Tianjin Medical Journal ›› 2025, Vol. 53 ›› Issue (6): 614-618.doi: 10.11958/20250665
• Clinical Research • Previous Articles Next Articles
WANG Haicheng1( ), ZHAO Yihan1, XIE Meiyi2, ZHAO Yuming1,△()
Received:2025-02-19
Revised:2025-03-25
Published:2025-06-15
Online:2025-06-20
Contact:
△E-mail: WANG Haicheng, ZHAO Yihan, XIE Meiyi, ZHAO Yuming. Predictive value of SUVmax and SUVmean parameters in 18F-PSMA-1007 PET/CT for the diagnosis and disease progression of prostate cancer[J]. Tianjin Medical Journal, 2025, 53(6): 614-618.
CLC Number:
| 组别 | n | 年龄/岁 | 前列腺体积/mL | 家族病史 |
|---|---|---|---|---|
| 非PCa组 | 31 | 59.87±7.54 | 38.82±5.61 | 3(11.9) |
| PCa组 | 49 | 58.86±6.78 | 39.30±5.76 | 6(20.5) |
| χ2或t | 0.621 | 0.367 | 0.125 |
Tab.1 Comparison of general clinical data between the two groups
| 组别 | n | 年龄/岁 | 前列腺体积/mL | 家族病史 |
|---|---|---|---|---|
| 非PCa组 | 31 | 59.87±7.54 | 38.82±5.61 | 3(11.9) |
| PCa组 | 49 | 58.86±6.78 | 39.30±5.76 | 6(20.5) |
| χ2或t | 0.621 | 0.367 | 0.125 |
| 组别 | n | SUVmax | SUVmean |
|---|---|---|---|
| 非PCa组 | 31 | 10.31±2.20 | 4.63±0.91 |
| PCa组 | 49 | 15.44±3.50 | 6.30±1.33 |
| t | 7.291** | 6.135** |
Tab.2 Comparison of 18F-PSMA-1007 PET/CT quantitative parameters between the two groups
| 组别 | n | SUVmax | SUVmean |
|---|---|---|---|
| 非PCa组 | 31 | 10.31±2.20 | 4.63±0.91 |
| PCa组 | 49 | 15.44±3.50 | 6.30±1.33 |
| t | 7.291** | 6.135** |
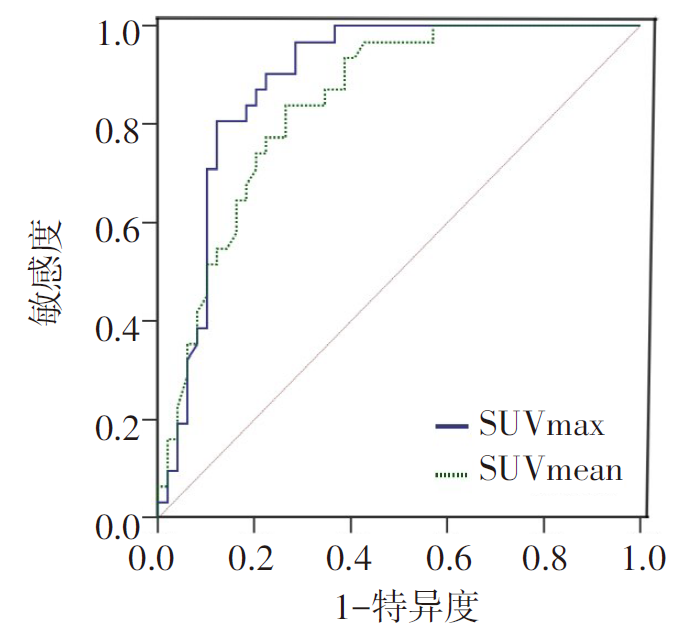
Fig.1 ROC curves of 18F-PSMA-1007 PET/CT parameters in diagnosing PCa
| 参数 | 截断值 | AUC | 95%CI | 敏感度/% | 特异度/% | 约登指数 |
|---|---|---|---|---|---|---|
| SUVmax | 14.13 | 0.887 | 0.797~0.947 | 80.65 | 87.76 | 0.684 |
| SUVmean | 5.57 | 0.843 | 0.744~0.914 | 83.87 | 73.47 | 0.573 |
Tab.3 Diagnostic efficiency of 18F-PSMA-1007 PET/CT parameters for PCa
| 参数 | 截断值 | AUC | 95%CI | 敏感度/% | 特异度/% | 约登指数 |
|---|---|---|---|---|---|---|
| SUVmax | 14.13 | 0.887 | 0.797~0.947 | 80.65 | 87.76 | 0.684 |
| SUVmean | 5.57 | 0.843 | 0.744~0.914 | 83.87 | 73.47 | 0.573 |
| 时间 | PSA/(μg/L) | GLEASON评分/分 |
|---|---|---|
| 入院时 | 24.61±3.14 | 4.27±0.53 |
| 入院3个月后 | 21.89±3.08 | 3.71±0.50 |
| t | 4.329** | 5.380** |
Tab.4 Comparison of PSA and GLEASON score between different examination time points
| 时间 | PSA/(μg/L) | GLEASON评分/分 |
|---|---|---|
| 入院时 | 24.61±3.14 | 4.27±0.53 |
| 入院3个月后 | 21.89±3.08 | 3.71±0.50 |
| t | 4.329** | 5.380** |
| 参数 | PSA | GLEASON评分 | ||
|---|---|---|---|---|
| 入院时 | 入院3个月 | 入院时 | 入院3个月 | |
| SUVmax | 0.439** | 0.387** | 0.388** | 0.367* |
| SUVmean | 0.406** | 0.376** | 0.293* | 0.332* |
Tab.5 Correlation between 18F-PSMA-1007 PET/CT parameters, PSA and GLEASON score
| 参数 | PSA | GLEASON评分 | ||
|---|---|---|---|---|
| 入院时 | 入院3个月 | 入院时 | 入院3个月 | |
| SUVmax | 0.439** | 0.387** | 0.388** | 0.367* |
| SUVmean | 0.406** | 0.376** | 0.293* | 0.332* |
| [1] | SUNG H, FERLAY J, SIEGEL R L, et al. Global Cancer Statistics 2020:GLOBOCAN estimates of incidence and mortality worldwide for 36 cancers in 185 countries[J]. CA Cancer J Clin, 2021, 71(3):209-249. doi:10.3322/caac.21660. |
| [2] | ZHOU J, DING J, QI J. Comparison of typical prostate adenocarcinoma and rare histological variant prostate cancer showed different characteristics and prognosis:A surveillance,epidemiology,and end results database analysis[J]. Eur Urol, 2022, 82(2):152-155. doi:10.1016/j.eururo.2022.02.006. |
| [3] | 胡尘翰, 乔晓梦, 包婕, 等. 前列腺癌局部复发影像报告系统对前列腺癌根治术后局部复发的诊断效能及观察者间评分一致性研究[J]. 中华放射学杂志, 2024, 58(3):293-300. |
| HU C H, QIAO X M, BAO J, et al. Diagnostic performance and inter-observer consistency of prostate imaging recurrence reporting system in the detection of local recurrence after radical prostatectomy in patients with prostate cancer[J]. Chin J Radiol, 2024, 58(3):293-300. doi:10.3760/cma.j.cn112149-20231012-00285. | |
| [4] | 姜一逸, 刘芙岑, 李波良, 等. 18F-PSMA-1007与18F-FDG PET/CT及多参数MRI在前列腺癌诊断中的对比研究[J]. 中华核医学与分子影像杂志, 2024, 44(3):147-152. |
| JIANG Y Y, LIU F C, LI B L, et al. Comparative study of 18F-PSMA-1007,18F-FDG PET/CT and mpMRI in the diagnosis of prostate cancer[J]. Chin J Nucl Med Mol Imaging, 2024, 44(3):147-152. doi:10.3760/cma.j.cn321828-20230320-00069. | |
| [5] | 李艳梅, 李艳, 陈健, 等. 基于18F-PSMA-1007 PET/CT及临床病理因素预测前列腺癌转移的诊断价值[J]. 放射学实践, 2023, 38(7):925-930. |
| LI Y M, LI Y, CHEN J, et al. The diagnostic value of predicting prostate cancer metastasis based on 18F-PSMA-1007 PET/CT and clinical and pathological factors[J]. Radiol Prac, 2023, 38(7):925-930. doi:10.13609/j.cnki.1000-0313.2023.07.020. | |
| [6] | 朱斌, 刘畅, 许晓平, 等. 18F-PSMA-1007 PET/CT和mpMRI在前列腺癌原发灶检测及病灶腺体内定位的对比研究[J]. 肿瘤影像学, 2023, 32(3):226-236. |
| ZHU B, LIU C, XU X P, et al. Comparison of 18F-PSMA-1007 PET/CT and mpMRI in the detection and intraprostatic localization of primary prostate cancer[J]. Oncoradiology, 2023, 32(3):226-236. doi:10.19732/j.cnki.2096-6210.2023.03.003. | |
| [7] | FOLEY R W, REDMAN S L, GRAHAM R N, et al. Fluorine-18 labelled prostate-specific membrane antigen(PSMA)-1007 positron-emission tomography-computed tomography: normal patterns,pearls,and pitfalls[J]. Clin Radiol, 2020, 75(12):903-913. doi:10.1016/j.crad.2020.06.031. |
| [8] | 钟凯翔, 侯鹏, 吕杰, 等. 18F-PSMA-1007、68Ga-PSMA-11及18F-FDG PET/CT对初诊可疑前列腺癌的诊断效能比较[J]. 中国医学影像学杂志, 2023, 31(8):865-871. |
| ZHONG K X, HOU P, LYU J, et al. Diagnostic performance of 18F-PSMA-1007,68Ga-PSMA-11 and 18F-FDG PET/CT in newly diagnosed suspicious prostate cancer:a comparative study[J]. Chinese Journal of Medical Imaging, 2023, 31(8):865-871. doi:10.3969/j.issn.1005-5185.2023.08.015. | |
| [9] | 丁婷婷, 郝珊瑚, 王治国, 等. 18F-PSMA-1007 PET/CT与18F-FDG PET/CT对前列腺癌骨转移的诊断价值比较[J]. 江苏大学学报(医学版), 2023, 33(5):369-373,379. |
| DING T T, HAO S H, WANG Z G, et al. Diagnostic value of 18F-prostate-specific membrane antigen-1007 PET/CT versus 18F-deoxyglucose PET/CT for bone metastasis in prostate cancer[J]. Journal of Jiangsu University(Medicine Edition), 2023, 33(5):369-373,379. doi:10.13312/j.issn.1671-7783.y230003. | |
| [10] | 章明, 马晓芬, 楼云龙, 等. 18F-PSMA-1007 PET/CT显像可无创精准诊断前列腺癌并确定分期[J]. 分子影像学杂志, 2024, 47(1):1-6. |
| ZHANG M, MA X F, LOU Y L, et al. 18F-PSMA-1007 PET/CT examination can noninvasively diagnose and stage the vast majority of prostate cancer[J]. Journal of Molecular Imaging, 2024, 47(1):1-6. doi:10.12122/j.issn.1674-4500.2024.01.01. | |
| [11] | 罗量, 常儒玺, 李运轩, 等. 基于18F-PSMA-1007 PET/CT影像组学模型在前列腺癌与前列腺增生鉴别诊断中的价值[J]. 中华核医学与分子影像杂志, 2024, 44(2):80-85. |
| LUO L, CHANG R X, LI Y X, et al. Value of 18F-PSMA-1007 PET/CT-based radiomics model for differential diagnosis between prostate cancer and benign prostatic hyperplasia[J]. Chin J Nucl Med Mol Imaging, 2024, 44(2):80-85. doi:10.3760/cma.j.cn321828-20231115-00107. | |
| [12] | SONNI I, FELKER E R, LENIS A T, et al. Head-to-head comparison of 68Ga-PSMA-11 PET/CT and mpMRI with a histopathology gold standard in the detection,intraprostatic localization,and determination of local extension of primary prostate cancer:Results from a prospective single-center imaging trial[J]. J Nucl Med, 2022, 63(6):847-854. doi:10.2967/jnumed.121.262398. |
| [13] | 保兰兰, 赵铭, 田蓉蓉, 等. 改良的18F-PSMA-1007 PET-CT评分与mpMRI PI-RADS评分诊断前列腺癌的效果比较[J]. 肿瘤研究与临床, 2024, 36(9):670-677. |
| BAO L L, ZHAO M, TIAN R R, et al. Effect comparison between improved 18F-PSMA-1007 PET-CT score and mpMRI PI-RADS score for diagnosis of prostate cancer[J]. Cancer Research and Clinic, 2024, 36(9):670-677. doi:10.3760/cma.j.cn115355-20240111-00030. | |
| [14] | LUO L, ZHENG A, CHANG R, et al. Evaluating the value of 18F-PSMA-1007 PET/CT in the detection and identification of prostate cancer using histopathology as the standard[J]. Cancer Imaging, 2023, 23(1):108. doi:10.1186/s40644-023-00627-x. |
| [15] | 郑安琪, 王卓楠, 李运轩, 等. 18F-PSMA-1007 PET/CT对前列腺癌精囊腺侵犯的诊断价值[J]. 中华核医学与分子影像杂志, 2023, 43(9):523-527. |
| ZHENG A Q, WANG Z N, LI Y X, et al. Diagnostic value of 18F-PSMA-1007 PET/CT in seminal vesicle invasion of prostate cancer[J]. Chin J Nucl Med Mol Imaging, 2023, 43(9):523-527. doi:10.3760/cma.j.cn321828-20220505-00140. | |
| [16] | 刘伊扬, 毛兴君, 夏佳东. 前列腺小体外泄蛋白联合PSA在PSA“灰区”且PI-RADS评分3分前列腺癌诊断中的临床意义[J]. 中华男科学杂志, 2024, 30(7):597-603. |
| LIU Y Y, MAO X J, XIA J D. Clinical significance of prostatic exosomal protein and PSA in detecting prostate cancer with the PSA gray zone and PI-RADS-3 lesions[J]. Natl J Androl, 2024, 30(7):597-603. doi:10.13263/j.cnki.nja.2024.07.003. | |
| [17] | 陈丹丹, 楼云龙, 宋丽. 18F-PSMA-1007 PET/CT应用不同诊断标准对前列腺癌诊断效能的比较[J]. 现代肿瘤医学, 2023, 31(15):2895-2899. |
| CHEN D D, LOU Y L, SONG L. Comparison of the diagnostic efficacy of 18F-PSMA-1007 PET/CT using different diagnostic criteria for prostate cancer[J]. Modern Oncology, 2023, 31(15):2895-2899. doi:10.3969/j.issn.1672-4992.2023.15.024. | |
| [18] | 张振华, 付伟, 刘伟良, 等. PET/CT影像组学结合LncRNA-DGCR5在NSCLC精准医疗中的应用研究[J]. 天津医药, 2023, 51(9):1011-1015. |
| ZHANG Z H, FU W, LIU W L, et al. Application of PET/CT radiomics combined with LncRNA-DGCR5 in precision medicine of NSCLC[J]. Tianjin Med J, 2023, 51(9):1011-1015. doi:10.11958/20221865. |
| Viewed | ||||||
|
Full text |
|
|||||
|
Abstract |
|
|||||