Tianjin Medical Journal ›› 2025, Vol. 53 ›› Issue (1): 88-92.doi: 10.11958/20241148
• Clinical Research • Previous Articles Next Articles
WEI Sicheng1( ), YU Sui1,2,△(), YU Ying1, LI Huafeng2, ZHANG Qi2, TANG Yuxiao2, WANG Qiuling2, YU Xiao2
Received:2024-08-20
Revised:2024-11-05
Published:2025-01-15
Online:2025-02-06
Contact:
△E-mail:WEI Sicheng, YU Sui, YU Ying, LI Huafeng, ZHANG Qi, TANG Yuxiao, WANG Qiuling, YU Xiao. Correlation between systemic inflammation markers and bone mineral density in male patients with type 2 diabetes[J]. Tianjin Medical Journal, 2025, 53(1): 88-92.
CLC Number:
| 组别 | n | 年龄/岁 | 糖尿病病程/年 | BMI/(kg/m2) | SBP/(mmHg) | DBP/(mmHg) | TC/(mmol/L) | TG/(mmol/L) | |||||||||||||
|---|---|---|---|---|---|---|---|---|---|---|---|---|---|---|---|---|---|---|---|---|---|
| 骨量正常组 | 96 | 61(55,66) | 12.0(7.0,18.0) | 26.35(24.80,28.35) | 137.0(129.3,147.0) | 82.9±9.5 | 4.81(3.81,5.50) | 1.14(0.89,1.65) | |||||||||||||
| 骨量减少组 | 111 | 63(58,69) | 11.0(5.0,17.0) | 24.80(23.20,26.82)a | 134.0(124.0,148.0) | 80.2±11.0 | 4.66(3.90,5.37) | 1.11(0.81,1.59) | |||||||||||||
| 骨质疏松组 | 54 | 63(59,71) | 10.0(2.0,19.3) | 24.18(21.45,26.13)a | 137.6(127.3,146.0) | 83.2±11.8 | 4.92(3.71,5.76) | 1.27(0.83,1.85) | |||||||||||||
| H或F | 4.368 | 2.670 | 24.990** | 2.164 | 5.518 | 0.466 | 1.112 | ||||||||||||||
| 组别 | LDL-C/(mmol/L) | HDL-C/(mmol/L) | UA/(mmol/L) | 钙/(mmol/L) | 磷/(mmol/L) | HbA1c/% | 空腹C肽/(μg/L) | ||||||||||||||
| 骨量正常组 | 2.87(2.29,3.54) | 1.29(1.04,1.46) | 337.0(281.0,391.0) | 2.32(2.28,2.38) | 1.20(1.10,1.32) | 8.6(7.5,9.7) | 1.37(0.91,2.10) | ||||||||||||||
| 骨量减少组 | 2.94(2.20,3.56) | 1.16(1.01,1.34) | 337.0(281.0,391.0) | 2.31(2.25,2.38) | 1.18(1.10,1.32) | 9.1(7.7,10.8) | 1.37(0.88,2.07) | ||||||||||||||
| 骨质疏松组 | 2.99(2.03,3.74) | 1.22(0.96,1.36) | 329.5(260.8,382.5) | 2.31(2.26,2.40) | 1.18(1.04,1.34) | 9.5(8.7,11.4)a | 1.49(0.90,1.96) | ||||||||||||||
| H | 0.386 | 4.938 | 3.513 | 1.729 | 0.729 | 13.520** | 0.243 | ||||||||||||||
| 组别 | FBG/(mmol/L) | 25(OH)D/(μg/L) | β-CTX/(ng/L) | OC/(μg/L) | P1NP/(μg/L) | PTH/(ng/L) | |||||||||||||||
| 骨量正常组 | 7.53(6.09,9.14) | 22.2(19.7,24.9) | 360(258,479) | 10.9(9.0,14.2) | 33.7(27.1,42.9) | 34.1(26.3,44.8) | |||||||||||||||
| 骨量减少组 | 7.41(6.24,8.83) | 21.5(18.1,25.9) | 389(300,604)a | 11.5(9.6,14.5) | 34.9(28.5,47.1) | 34.2(26.8,39.9) | |||||||||||||||
| 骨质疏松组 | 8.71(6.59,11.08)b | 22.2(19.7,24.9) | 539(402,702)ab | 12.9(10.8,17.6)a | 44.2(33.0,56.1)ab | 33.3(26.3,43.3) | |||||||||||||||
| H | 6.627* | 0.041 | 26.994** | 9.402** | 17.077** | 0.346 | |||||||||||||||
Tab.1 Comparison of clinical characteristics between three groups
| 组别 | n | 年龄/岁 | 糖尿病病程/年 | BMI/(kg/m2) | SBP/(mmHg) | DBP/(mmHg) | TC/(mmol/L) | TG/(mmol/L) | |||||||||||||
|---|---|---|---|---|---|---|---|---|---|---|---|---|---|---|---|---|---|---|---|---|---|
| 骨量正常组 | 96 | 61(55,66) | 12.0(7.0,18.0) | 26.35(24.80,28.35) | 137.0(129.3,147.0) | 82.9±9.5 | 4.81(3.81,5.50) | 1.14(0.89,1.65) | |||||||||||||
| 骨量减少组 | 111 | 63(58,69) | 11.0(5.0,17.0) | 24.80(23.20,26.82)a | 134.0(124.0,148.0) | 80.2±11.0 | 4.66(3.90,5.37) | 1.11(0.81,1.59) | |||||||||||||
| 骨质疏松组 | 54 | 63(59,71) | 10.0(2.0,19.3) | 24.18(21.45,26.13)a | 137.6(127.3,146.0) | 83.2±11.8 | 4.92(3.71,5.76) | 1.27(0.83,1.85) | |||||||||||||
| H或F | 4.368 | 2.670 | 24.990** | 2.164 | 5.518 | 0.466 | 1.112 | ||||||||||||||
| 组别 | LDL-C/(mmol/L) | HDL-C/(mmol/L) | UA/(mmol/L) | 钙/(mmol/L) | 磷/(mmol/L) | HbA1c/% | 空腹C肽/(μg/L) | ||||||||||||||
| 骨量正常组 | 2.87(2.29,3.54) | 1.29(1.04,1.46) | 337.0(281.0,391.0) | 2.32(2.28,2.38) | 1.20(1.10,1.32) | 8.6(7.5,9.7) | 1.37(0.91,2.10) | ||||||||||||||
| 骨量减少组 | 2.94(2.20,3.56) | 1.16(1.01,1.34) | 337.0(281.0,391.0) | 2.31(2.25,2.38) | 1.18(1.10,1.32) | 9.1(7.7,10.8) | 1.37(0.88,2.07) | ||||||||||||||
| 骨质疏松组 | 2.99(2.03,3.74) | 1.22(0.96,1.36) | 329.5(260.8,382.5) | 2.31(2.26,2.40) | 1.18(1.04,1.34) | 9.5(8.7,11.4)a | 1.49(0.90,1.96) | ||||||||||||||
| H | 0.386 | 4.938 | 3.513 | 1.729 | 0.729 | 13.520** | 0.243 | ||||||||||||||
| 组别 | FBG/(mmol/L) | 25(OH)D/(μg/L) | β-CTX/(ng/L) | OC/(μg/L) | P1NP/(μg/L) | PTH/(ng/L) | |||||||||||||||
| 骨量正常组 | 7.53(6.09,9.14) | 22.2(19.7,24.9) | 360(258,479) | 10.9(9.0,14.2) | 33.7(27.1,42.9) | 34.1(26.3,44.8) | |||||||||||||||
| 骨量减少组 | 7.41(6.24,8.83) | 21.5(18.1,25.9) | 389(300,604)a | 11.5(9.6,14.5) | 34.9(28.5,47.1) | 34.2(26.8,39.9) | |||||||||||||||
| 骨质疏松组 | 8.71(6.59,11.08)b | 22.2(19.7,24.9) | 539(402,702)ab | 12.9(10.8,17.6)a | 44.2(33.0,56.1)ab | 33.3(26.3,43.3) | |||||||||||||||
| H | 6.627* | 0.041 | 26.994** | 9.402** | 17.077** | 0.346 | |||||||||||||||
| 组别 | n | PLT/(×109/L) | NEU/(×109/L) | MONO/(×109/L) | LYM/(×109/L) | ||||
|---|---|---|---|---|---|---|---|---|---|
| 骨量正常组 | 96 | 191(163,222) | 3.38(2.66,3.95) | 0.50(0.40,0.58) | 1.96(1.64,2.32) | ||||
| 骨量减少组 | 111 | 201(162,245) | 3.62(2.90,4.54)a | 0.50(0.41,0.61) | 1.84(1.60,2.40) | ||||
| 骨质疏松组 | 54 | 213(183,264)a | 3.54(2.79,4.28) | 0.47(0.40,0.55) | 1.95(1.48,2.35) | ||||
| H | 8.263* | 6.211* | 3.349 | 0.628 | |||||
| 组别 | SII | NLR | MLR | PLR | |||||
| 骨量正常组 | 298(234,403) | 1.61(1.30,2.10) | 0.26(0.21,0.30) | 93(78,120) | |||||
| 骨量减少组 | 364(262,529)a | 1.83(1.46,2.42)a | 0.26(0.21,0.32) | 105(78,132) | |||||
| 骨质疏松组 | 345(266,591)a | 1.79(1.32,2.36)a | 0.25(0.19,0.31) | 104(90,144)a | |||||
| H | 9.357** | 7.097* | 2.385 | 6.816* | |||||
Tab. 2 Comparison of systemic inflammation makers between three groups of patients
| 组别 | n | PLT/(×109/L) | NEU/(×109/L) | MONO/(×109/L) | LYM/(×109/L) | ||||
|---|---|---|---|---|---|---|---|---|---|
| 骨量正常组 | 96 | 191(163,222) | 3.38(2.66,3.95) | 0.50(0.40,0.58) | 1.96(1.64,2.32) | ||||
| 骨量减少组 | 111 | 201(162,245) | 3.62(2.90,4.54)a | 0.50(0.41,0.61) | 1.84(1.60,2.40) | ||||
| 骨质疏松组 | 54 | 213(183,264)a | 3.54(2.79,4.28) | 0.47(0.40,0.55) | 1.95(1.48,2.35) | ||||
| H | 8.263* | 6.211* | 3.349 | 0.628 | |||||
| 组别 | SII | NLR | MLR | PLR | |||||
| 骨量正常组 | 298(234,403) | 1.61(1.30,2.10) | 0.26(0.21,0.30) | 93(78,120) | |||||
| 骨量减少组 | 364(262,529)a | 1.83(1.46,2.42)a | 0.26(0.21,0.32) | 105(78,132) | |||||
| 骨质疏松组 | 345(266,591)a | 1.79(1.32,2.36)a | 0.25(0.19,0.31) | 104(90,144)a | |||||
| H | 9.357** | 7.097* | 2.385 | 6.816* | |||||
| 变量 | B | SE | Wald χ2 | P | OR | OR 95%CI |
|---|---|---|---|---|---|---|
| NEU | 0.107 | 0.107 | 0.993 | 0.319 | 1.113 | 0.902~1.373 |
| PLT | 0.004 | 0.002 | 3.281 | 0.070 | 1.004 | 1.000~1.003 |
| SII | 0.001 | 0.001 | 4.523 | 0.033 | 1.001 | 1.000~1.003 |
| NLR | 0.318 | 0.168 | 3.588 | 0.058 | 1.374 | 0.989~1.908 |
| PLR | 0.007 | 0.003 | 5.335 | 0.021 | 1.007 | 1.001~1.013 |
Tab.3 Multi-factor Logistic regression analysis of inflammation makers and osteoporosis in male patients with T2DM
| 变量 | B | SE | Wald χ2 | P | OR | OR 95%CI |
|---|---|---|---|---|---|---|
| NEU | 0.107 | 0.107 | 0.993 | 0.319 | 1.113 | 0.902~1.373 |
| PLT | 0.004 | 0.002 | 3.281 | 0.070 | 1.004 | 1.000~1.003 |
| SII | 0.001 | 0.001 | 4.523 | 0.033 | 1.001 | 1.000~1.003 |
| NLR | 0.318 | 0.168 | 3.588 | 0.058 | 1.374 | 0.989~1.908 |
| PLR | 0.007 | 0.003 | 5.335 | 0.021 | 1.007 | 1.001~1.013 |
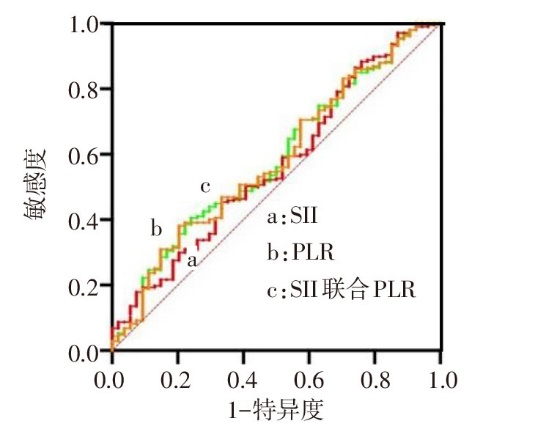
Fig.1 ROC curve of SII and PLR predicting osteoporosis in male patients with T2DM
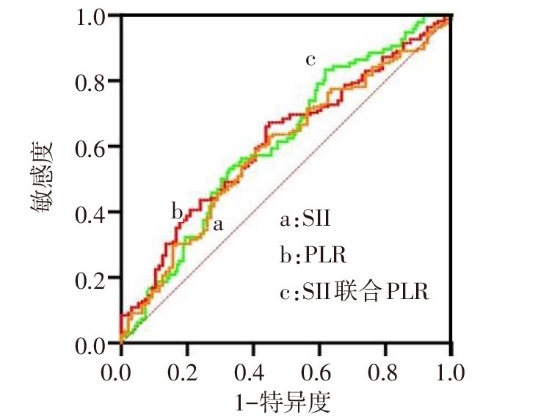
Fig.2 ROC curves of SII and PLR and their combination for predicting bone loss and osteoporosis
| 变量 | L1—4 | 左股骨颈 | 左髋关节 |
|---|---|---|---|
| NEU | -0.070 | -0.147 | -0.170* |
| PLT | -0.296** | -0.130 | -0.196* |
| SII | -0.233** | -0.186* | -0.249** |
| NLR | -0.082 | -0.150 | -0.175* |
| MLR | -0.020 | -0.058 | -0.057 |
| PLR | -0.202** | -0.041 | -0.129 |
Tab.4 Correlation between inflammation makers and BMD at different sites in male patients with T2DM and bone loss combined with osteoporosis
| 变量 | L1—4 | 左股骨颈 | 左髋关节 |
|---|---|---|---|
| NEU | -0.070 | -0.147 | -0.170* |
| PLT | -0.296** | -0.130 | -0.196* |
| SII | -0.233** | -0.186* | -0.249** |
| NLR | -0.082 | -0.150 | -0.175* |
| MLR | -0.020 | -0.058 | -0.057 |
| PLR | -0.202** | -0.041 | -0.129 |
| 变量 | P1NP | β-CTX | OC |
|---|---|---|---|
| NEU | 0.123* | 0.108 | -0.011 |
| PLT | 0.103 | 0.154* | -0.007 |
| SII | -0.007 | 0.069 | -0.047 |
| NLR | -0.075 | -0.005 | -0.066 |
| MLR | -0.140* | -0.097 | -0.075 |
| PLR | -0.102 | 0.022 | -0.033 |
Tab.5 Correlation between inflammation makers and BTM in male patients with T2DM
| 变量 | P1NP | β-CTX | OC |
|---|---|---|---|
| NEU | 0.123* | 0.108 | -0.011 |
| PLT | 0.103 | 0.154* | -0.007 |
| SII | -0.007 | 0.069 | -0.047 |
| NLR | -0.075 | -0.005 | -0.066 |
| MLR | -0.140* | -0.097 | -0.075 |
| PLR | -0.102 | 0.022 | -0.033 |
| [1] | WANG L, PENG W, ZHAO Z, et al. Prevalence and treatment of diabetes in China,2013-2018[J]. JAMA, 2021, 326(24):2498-2506. doi:10.1001/jama.2021.22208. |
| [2] | 中华医学会骨质疏松和骨矿盐疾病分会. 中国骨质疏松症流行病学调查及“健康骨骼”专项行动结果发布[J]. 中华骨质疏松和骨矿盐疾病杂志, 2019, 12(4):317-318. |
| Osteoporosis and Bone Mineral Salt Disease Branch, Chinese Medical Association. Epidemiological survey of osteoporosis in china and release of results of the “Healthy Bones” special action[J]. Chin J Osteoporos Bone Miner Res, 2019, 12(4):317-318. doi:10.3969/j.issn.1674-2591.2019.04.001. | |
| [3] | VILACA T, EASTELL R, SCHINI M. Osteoporosis in men[J]. Lancet Diabetes Endocrinol, 2022, 10(4):273-283. doi:10.1016/S2213-8587(22)00012-2. |
| [4] | 姜莹莹, 王靖宇, 孔岩, 等. 中性粒细胞/淋巴细胞比值与2型糖尿病患者肾小管损伤的相关性研究[J]. 天津医药, 2022, 50(1):83-87. |
| JIANG Y Y, WANG J Y, KONG Y, et al. Correlation between neutrophil/lymphocyte ratio and renal tubular injury in patients with type 2 diabetes mellitus[J]. Tianjin Med J, 2022, 50(1):83-87. doi:10.11958/20211431. | |
| [5] | 屠昌明, 田园, 汪鹏程, 等. SII、RAR与AECOPD患者病情严重程度及并发呼吸衰竭的关系[J]. 天津医药, 2024, 52(12):1317-1321. |
| TU C M, TIAN Y, WANG P C, et al. Relationship between SII,RAR and severity of disease and respiratory failure in patients with AECOPD[J]. Tianjin Med J, 2024, 52(12):1317-1321. doi:10.11958/20241172. | |
| [6] | 周泽霖, 尚奇, 卓航, 等. 男性原发骨质疏松症骨密度与新型炎症指标的相关性[J]. 中国骨质疏松杂志, 2023, 29(5):636-640,646. |
| ZHOU Z L, SHANG Q, ZHUO H, et al. Correlation between bone mineral density and new inflammatory markers in male primary osteoporosis[J]. Chin J Osteoporos, 2023, 29(5):636-640. doi:10.3969/j.issn.1006-7108.2023.05.003. | |
| [7] | KANY S, VOLLRATH J T, RELJA B. Cytokines in inflammatory disease[J]. Int J Mol Sci, 2019, 20(23):6008. doi:10.3390/ijms20236008. |
| [8] | ZHANG W, ZHAO W, LI W, et al. The imbalance of cytokines and lower levels of tregs in elderly male primary osteoporosis[J]. Front Endocrinol(Lausanne), 2022,13:779264. doi:10.3389/fendo.2022.779264. |
| [9] | SHEU A, GREENFIELD J R, WHITE C P, et al. Assessment and treatment of osteoporosis and fractures in type 2 diabetes[J]. Trends Endocrinol Metab, 2022, 33(5):333-344. doi:10.1016/j.tem.2022.02.006. |
| [10] | PRASAD T N, ARJUNAN D, PAL R, et al. Diabetes and osteoporosis[J]. Indian J Orthop, 2023, 57(Suppl 1):209-217. |
| [11] | TRIFAN G, TESTAI F D. Systemic Immune-Inflammation (SII) index predicts poor outcome after spontaneous supratentorial intracerebral hemorrhage[J]. J Stroke Cerebrovasc Dis, 2020, 29(9):105057. doi:10.1016/j.jstrokecerebrovasdis.2020.105057. |
| [12] | LI H, ZHANG X, ZHANG Q, et al. The relationship between the monocyte-to-lymphocyte ratio and osteoporosis in postmenopausal females with T2DM:a retrospective study in Chinese population[J]. Front Endocrinol(Lausanne), 2023,14:1112534. doi:10.3389/fendo.2023.1112534. |
| [13] | 冯红红, 高飞. 新型炎症因子与原发性骨质疏松症的研究进展[J]. 中国骨质疏松杂志, 2022, 28(1):152-156. |
| FENG H H, GAO F. Research progress on novel inflammatory factors and primary osteoporosis[J]. Chin J Osteoporos, 2022, 28(1):152-156. doi:10.3969/j.issn.1006-7108.2022.01.031. | |
| [14] | CHEN S, SUN X, JIN J, et al. Association between inflammatory markers and bone mineral density:a cross-sectional study from NHANES 2007-2010[J]. J Orthop Surg Res, 2023, 18(1):305. doi:10.1186/s13018-023-03795-5. |
| [15] | KARNIK S J, NAZZAL M K, KACENA M A, et al. Megakaryocyte secreted factors regulate bone marrow niche cells during skeletal homeostasis,aging,and disease[J]. Calcif Tissue Int, 2023, 113(1):83-95. doi:10.1007/s00223-023-01095-y. |
| [16] | STAVNICHUK M, KOMAROVA S V. Megakaryocyte-bone cell interactions:lessons from mouse models of experimental myelofibrosis and related disorders[J]. Am J Physiol Cell Physiol, 2022, 322(2):C177-C184. doi:10.1152/ajpcell.00328.2021. |
| [17] | JIANG Y, ZHU Y, SHAO Y, et al. Platelet-derived apoptotic vesicles promote bone regeneration via golgi phosphoprotein 2(GOLPH2)-AKT signaling axis[J]. ACS Nano, 2023, 17(24):25070-25090. doi:10.1021/acsnano.3c07717. |
| [18] | 刘洋, 王文波. 富血小板血浆在骨修复中的机制及应用[J]. 临床与病理杂志, 2019, 39(9):2041-2046. |
| LIU Y, WANG W B. Mechanism and application of platelet-rich plasma in bone repair[J]. J Clin Pathol Res, 2019, 39(9):2041-2046. doi:10.3978/j.issn.2095-6959.2019.09.031. | |
| [19] | KUMAR A, MAHENDRA J, MAHENDRA L, et al. Synergistic effect of biphasic calcium phosphate and platelet-rich fibrin attenuate markers for inflammation and osteoclast differentiation by suppressing NF-κB/MAPK signaling pathway in chronic periodontitis[J]. Molecules, 2021, 26(21):6578. doi:10.3390/ molecules26216578. |
| [20] | SALAMANNA F, MAGLIO M, SARTORI M, et al. Platelet features and derivatives in osteoporosis:a rational and systematic review on the best evidence[J]. Int J Mol Sci, 2020, 21(5):1762. doi:10.3390/ijms21051762. |
| [21] | FRASE D, LEE C, NACHIAPPAN C, et al. The inflammatory contribution of B-lymphocytes and neutrophils in progression to osteoporosis[J]. Cells, 2023, 12(13):1744. doi:10.3390/cells12131744. |
| [22] | LI J, YAO Z, LIU X, et al. TGFβ1+CCR5+ neutrophil subset increases in bone marrow and causes age-related osteoporosis in male mice[J]. Nat Commun, 2023, 14(4):159. doi:10.1038/s41467-023-35801-z. |
| [1] | ZHOU Liyun, WANG Yan, DONG Benchao, YANG Peichuan, SHEN Jiahui, MA Jianxiong, MA Xinlong. Advances in the use of stem cell mechanical sensitivity against osteoporosis [J]. Tianjin Medical Journal, 2024, 52(8): 877-881. |
| [2] | WANG Min, WANG Longsheng, CHEN Lei. Construction of a prediction model for lumbar fracture in patients with osteoporosis [J]. Tianjin Medical Journal, 2024, 52(7): 766-769. |
| [3] | WANG Lei, YANG Tao, GENG Licheng, SUN Tianwei. Research progress of endocannabinoid system for prevention and treatment of osteoporosis [J]. Tianjin Medical Journal, 2023, 51(9): 1020-1024. |
| [4] | Osteoporosis and Bone Mineral Disease Branch of Tianjin Medical Association, Society of Oral and Maxillofacial Surgery of Tianjin Stomatological Association. Expert consensus on anti-osteoporosis therapy and medication-related jaw necrosis in Tianjin [J]. Tianjin Medical Journal, 2023, 51(9): 897-903. |
| [5] | WANG Yan, SHAO Hongxia, ZHANG Kairu, ZHENG Xingjie, WU Junping, YU Hongzhi. Distribution and clinical feathers of 106 patients with non-tuberculous mycobacteria pulmonary diseases in Tianjin [J]. Tianjin Medical Journal, 2023, 51(6): 633-636. |
| [6] | LIU Aixia, ZHANG Qingling, WU Zhijuan. Therapeutic effect of salvia miltiorrhiza polyphenolic acid on immune infertility rats and its effect on hypothalamic-pituitary-ovarian axis [J]. Tianjin Medical Journal, 2023, 51(3): 269-273. |
| [7] | QIAN Li, WANG Dashou, PAN Qi, XIAO Yang, DUAN Binwu, CHEN Qian. Analysis of clinical effect of vertebroplasty combined with zoledronate in preventing postoperative recurrence of vertebral fractures [J]. Tianjin Medical Journal, 2023, 51(11): 1258-1261. |
| [8] | TAN Bo, HU Jiang, LU Bing, YUAN Jiabin, WEI Dan, ZHU Zongdong, LIAO Feng, TANG Xiaoming. Changes of serum H2S in patients with osteoporosis and its clinical significance [J]. Tianjin Medical Journal, 2022, 50(8): 832-835. |
| [9] | ZHAI Xinxiang, DONG Hui, WANG Jing, WANG Yongxiang. Study on the protective mechanism of astragalus polysaccharides on functional activity of osteoblasts in ovariectomy rats [J]. Tianjin Medical Journal, 2022, 50(3): 265-269. |
| [10] | HOU Tian, QIN Yazhi, ZHANG Yan, WEN Guochen, ZHANG Xiao, DONG Wei. Zoledronate regulates osteoblast differentiation in high glucose microenvironment via p38 MAPK signaling pathway [J]. Tianjin Medical Journal, 2022, 50(12): 1239-1245. |
| [11] | ZHANG Yimeng, ZHANG Yuxin, TIAN Faming. The analysis and verification of osteoporosis associated hub genes and prediction of miRNA interactions [J]. Tianjin Medical Journal, 2022, 50(11): 1158-1164. |
| [12] | YANG Ya-nan, GAO Jing, LI Xiao-wei, MA Jing, XIAO Jian-yong, GAO Ming-dong, LIU Yin. The relationship between smoking and the severity of coronary lesions in male patients≤45 years old with premature myocardial infarction [J]. Tianjin Medical Journal, 2021, 49(4): 396-400. |
| [13] | TIAN Yong-gang, HAN Li-qiang, WANG Tong-hao, LIU Zhi, GUO Shu-zhang. Therapeutic effect of percutaneous kyphoplasty companied with target puncture in the treatment of osteoporotic vertebral compression fractures [J]. Tianjin Medical Journal, 2021, 49(10): 1067-1071. |
| [14] | ZHA Xiao-min, ZHU Fu-xi, ZHANG Jing-jing, XU Yuan-hong△. Correlation analysis of sperm DFI, semen routine an sperm morphology and effection of sperm DFI on IVF-ET/ICSI outcome [J]. Tianjin Medical Journal, 2021, 49(1): 45-49. |
| [15] | WEI Jin-xing, WANG Nuo-xin, LUO Yi, XU Yan, XIAO Jian-hui△. Research progress on prevention and treatment of osteoporosis with plant-derived natural small molecular compounds [J]. Tianjin Medical Journal, 2021, 49(1): 107-112. |
| Viewed | ||||||
|
Full text |
|
|||||
|
Abstract |
|
|||||