Tianjin Medical Journal ›› 2025, Vol. 53 ›› Issue (5): 523-527.doi: 10.11958/20250620
• Clinical Research • Previous Articles Next Articles
BAO Jiajun1( ), GU Ting2, GU Yunjuan3
Received:2025-02-18
Revised:2025-03-06
Published:2025-05-15
Online:2025-05-28
BAO Jiajun, GU Ting, GU Yunjuan. Correlation between serum RAR, FAM19A5 and LECT2 expression and glycolipid metabolism in patients with type 2 diabetes mellitus complicated with metabolic syndrome[J]. Tianjin Medical Journal, 2025, 53(5): 523-527.
CLC Number:
| 组别 | n | TC/ (mmol/L) | TG/ (mmol/L) | HDL-C/ (mmol/L) | LDL-C/ (mmol/L) | ||||
|---|---|---|---|---|---|---|---|---|---|
| 对照组 | 93 | 3.49±0.38 | 1.17±0.14 | 1.31±0.16 | 2.37±0.26 | ||||
| 研究组 | 119 | 4.50±0.48 | 2.23±0.25 | 1.16±0.17 | 2.71±0.29 | ||||
| t | 16.623** | 36.634** | 6.541** | 8.860** | |||||
| 组别 | FBG/ (mmol/L) | RAR | FAM19A5/(ng/L) | LECT2/ (μg/L) | |||||
| 对照组 | 4.95±0.52 | 0.26±0.05 | 102.43±19.21 | 15.41±3.96 | |||||
| 研究组 | 9.36±0.97 | 0.37±0.08 | 152.79±28.64 | 29.87±6.54 | |||||
| t | 39.608** | 11.604** | 14.583** | 18.794** | |||||
Tab.1 Comparison of glycolipid metabolism indicators and serum RAR, FAM19A5, and LECT2 levels between the study group and the control group
| 组别 | n | TC/ (mmol/L) | TG/ (mmol/L) | HDL-C/ (mmol/L) | LDL-C/ (mmol/L) | ||||
|---|---|---|---|---|---|---|---|---|---|
| 对照组 | 93 | 3.49±0.38 | 1.17±0.14 | 1.31±0.16 | 2.37±0.26 | ||||
| 研究组 | 119 | 4.50±0.48 | 2.23±0.25 | 1.16±0.17 | 2.71±0.29 | ||||
| t | 16.623** | 36.634** | 6.541** | 8.860** | |||||
| 组别 | FBG/ (mmol/L) | RAR | FAM19A5/(ng/L) | LECT2/ (μg/L) | |||||
| 对照组 | 4.95±0.52 | 0.26±0.05 | 102.43±19.21 | 15.41±3.96 | |||||
| 研究组 | 9.36±0.97 | 0.37±0.08 | 152.79±28.64 | 29.87±6.54 | |||||
| t | 39.608** | 11.604** | 14.583** | 18.794** | |||||
| 组别 | n | 年龄/岁 | 性别(男/女) | BMI/(kg/m2) | T2DM病程/年 | 吸烟史 | 饮酒史 | 高血压史 | |||||||||||||
|---|---|---|---|---|---|---|---|---|---|---|---|---|---|---|---|---|---|---|---|---|---|
| 非MS组 | 52 | 59.24±10.26 | 25/27 | 26.09±3.05 | 8.04±4.92 | 9(17.31) | 6(11.54) | 11(21.15) | |||||||||||||
| MS组 | 67 | 57.13±9.85 | 29/38 | 27.63±3.49 | 9.76±4.25 | 12(17.91) | 9(13.43) | 26(38.81) | |||||||||||||
| t或χ2 | 1.138 | 0.271 | 2.521* | 2.044* | 0.007 | 0.095 | 4.258* | ||||||||||||||
| 组别 | 收缩压/mmHg | 舒张压/mmHg | 腰围/cm | RAR | FAM19A5/(ng/L) | LECT2/(μg/L) | TC/(mmol/L) | ||||||||||||||
| 非MS组 | 123.21±13.27 | 78.20±7.48 | 87.11±8.69 | 0.31±0.07 | 126.54±24.26 | 24.76±5.19 | 4.47±0.58 | ||||||||||||||
| MS组 | 129.42±11.85 | 83.76±8.13 | 96.27±9.16 | 0.42±0.11 | 173.16±32.71 | 33.84±7.42 | 4.53±0.42 | ||||||||||||||
| T | 2.691** | 3.831** | 5.533** | 6.287** | 8.601** | 7.510** | 0.654 | ||||||||||||||
| 组别 | TG/(mmol/L) | HDL-C/(mmol/L) | LDL-C/(mmol/L) | FINS/(mU/L) | FBG/(mmol/L) | HbA1c/% | HOMA-IR | ||||||||||||||
| 非MS组 | 1.21±0.27 | 1.30±0.33 | 2.75±0.29 | 5.84±1.08 | 8.72±1.15 | 7.23±1.08 | 2.14±0.58 | ||||||||||||||
| MS组 | 3.03±0.89 | 1.05±0.27 | 2.68±0.36 | 9.64±1.79 | 9.85±1.07 | 8.96±2.14 | 3.94±0.83 | ||||||||||||||
| T | 14.235** | 4.545** | 1.143 | 13.511** | 5.530** | 5.324** | 13.313** | ||||||||||||||
Tab.2 Comparison of clinical data of T2DM patients between the MS group and the non-MS group
| 组别 | n | 年龄/岁 | 性别(男/女) | BMI/(kg/m2) | T2DM病程/年 | 吸烟史 | 饮酒史 | 高血压史 | |||||||||||||
|---|---|---|---|---|---|---|---|---|---|---|---|---|---|---|---|---|---|---|---|---|---|
| 非MS组 | 52 | 59.24±10.26 | 25/27 | 26.09±3.05 | 8.04±4.92 | 9(17.31) | 6(11.54) | 11(21.15) | |||||||||||||
| MS组 | 67 | 57.13±9.85 | 29/38 | 27.63±3.49 | 9.76±4.25 | 12(17.91) | 9(13.43) | 26(38.81) | |||||||||||||
| t或χ2 | 1.138 | 0.271 | 2.521* | 2.044* | 0.007 | 0.095 | 4.258* | ||||||||||||||
| 组别 | 收缩压/mmHg | 舒张压/mmHg | 腰围/cm | RAR | FAM19A5/(ng/L) | LECT2/(μg/L) | TC/(mmol/L) | ||||||||||||||
| 非MS组 | 123.21±13.27 | 78.20±7.48 | 87.11±8.69 | 0.31±0.07 | 126.54±24.26 | 24.76±5.19 | 4.47±0.58 | ||||||||||||||
| MS组 | 129.42±11.85 | 83.76±8.13 | 96.27±9.16 | 0.42±0.11 | 173.16±32.71 | 33.84±7.42 | 4.53±0.42 | ||||||||||||||
| T | 2.691** | 3.831** | 5.533** | 6.287** | 8.601** | 7.510** | 0.654 | ||||||||||||||
| 组别 | TG/(mmol/L) | HDL-C/(mmol/L) | LDL-C/(mmol/L) | FINS/(mU/L) | FBG/(mmol/L) | HbA1c/% | HOMA-IR | ||||||||||||||
| 非MS组 | 1.21±0.27 | 1.30±0.33 | 2.75±0.29 | 5.84±1.08 | 8.72±1.15 | 7.23±1.08 | 2.14±0.58 | ||||||||||||||
| MS组 | 3.03±0.89 | 1.05±0.27 | 2.68±0.36 | 9.64±1.79 | 9.85±1.07 | 8.96±2.14 | 3.94±0.83 | ||||||||||||||
| T | 14.235** | 4.545** | 1.143 | 13.511** | 5.530** | 5.324** | 13.313** | ||||||||||||||
| 指标 | RAR | FAM19A5 | LECT2 |
|---|---|---|---|
| TC | 0.127 | 0.089 | 0.171 |
| TG | 0.356** | 0.427** | 0.392** |
| HDL-C | -0.379** | -0.438** | -0.416** |
| LDL-C | -0.138 | -0.106 | -0.124 |
| FINS | 0.432** | 0.492** | 0.457** |
| FBG | 0.446** | 0.463** | 0.469** |
| HbA1c | 0.491** | 0.458** | 0.442** |
| HOMA-IR | 0.427** | 0.434** | 0.468** |
Tab.3 Correlation between serum RAR, FAM19A5, LECT2 and glycolipid metabolism indexes
| 指标 | RAR | FAM19A5 | LECT2 |
|---|---|---|---|
| TC | 0.127 | 0.089 | 0.171 |
| TG | 0.356** | 0.427** | 0.392** |
| HDL-C | -0.379** | -0.438** | -0.416** |
| LDL-C | -0.138 | -0.106 | -0.124 |
| FINS | 0.432** | 0.492** | 0.457** |
| FBG | 0.446** | 0.463** | 0.469** |
| HbA1c | 0.491** | 0.458** | 0.442** |
| HOMA-IR | 0.427** | 0.434** | 0.468** |
| 变量 | AUC(95%CI) | 截断值 | 敏感度 | 特异度 | 约登 指数 |
|---|---|---|---|---|---|
| RAR | 0.821(0.740~0.885) | 0.34 | 0.702 | 0.885 | 0.586 |
| FAM19A5 | 0.807(0.724~0.873) | 134.75 ng/L | 0.687 | 0.865 | 0.552 |
| LECT2 | 0.793(0.709~0.861) | 28.21 μg/L | 0.657 | 0.923 | 0.580 |
| 三者联合 | 0.952(0.896~0.983) | 0.925 | 0.846 | 0.772 |
Tab.4 Diagnostic value of serum RAR, FAM19A5 and LECT2 levels in T2DM patients with MS
| 变量 | AUC(95%CI) | 截断值 | 敏感度 | 特异度 | 约登 指数 |
|---|---|---|---|---|---|
| RAR | 0.821(0.740~0.885) | 0.34 | 0.702 | 0.885 | 0.586 |
| FAM19A5 | 0.807(0.724~0.873) | 134.75 ng/L | 0.687 | 0.865 | 0.552 |
| LECT2 | 0.793(0.709~0.861) | 28.21 μg/L | 0.657 | 0.923 | 0.580 |
| 三者联合 | 0.952(0.896~0.983) | 0.925 | 0.846 | 0.772 |
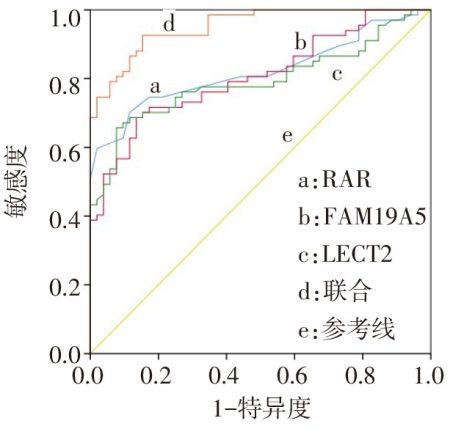
Fig.1 The ROC curve of serum RAR, FAM19A5 and LECT2 levels for the diagnose of T2DM patients with MS
| [1] | WU J, YANG K, FAN H, et al. Targeting the gut microbiota and its metabolites for type 2 diabetes mellitus[J]. Front Endocrinol(Lausanne), 2023, 14:1114424. doi:10.3389/fendo.2023.1114424. |
| [2] | 谷小娜, 陈新春, 寇永妹, 等. 唐山市路北区2020—2024年儿童代谢综合征的分布特征及危险因素分析[J]. 天津医药, 2025, 53(3):307-311. |
| GU X N, CHEN X C, KOU Y M, et al. Distribution characteristics and risk factors of metabolic syndrome in children in Lubei district of Tangshan City from 2020 to 2024[J]. Tianjin Med J, 2025, 53(3):307-311. doi:10.11958/20241665. | |
| [3] | 赖菁华, 郝明瑜, 徐睿晨, 等. 深圳地区2型糖尿病患者25羟基维生素D3水平与代谢综合征相关性的研究[J]. 中国糖尿病杂志, 2024, 32(8):576-580. |
| LAI J H, HAO M Y, XU R C, et al. Correlation between 25-hydroxy vitamin D3 level and metabolic syndrome in patients with type 2 diabetes mellitus in Shenzhen[J]. Chin J Diabetes, 2024, 32(8):576-580. doi:10.3969/j.issn.1006-6187.2024.08.003. | |
| [4] | ZHAO F, LIU M, KONG L. Association between red blood cell distribution width-to-albumin ratio and diabetic retinopathy[J]. J Clin Lab Anal, 2022, 36(4):e24351. doi:10.1002/jcla.24351. |
| [5] | YU M, PEI L, LIU H, et al. A novel inflammatory marker:relationship between red cell distribution width/albumin ratio and vascular complications in patients with type 2 diabetes mellitus[J]. J Inflamm Res, 2024, 17:6265-6276. doi:10.2147/JIR.S476048. |
| [6] | WESOłEK-LESZCZYŃSKA A, PASTUSIAK K, BOGDAŃSKI P, et al. Can adipokine FAM19A5 be a biomarker of metabolic disorders?[J]. Diabetes Metab Syndr Obes, 2024, 17:1651-1666. doi:10.2147/DMSO.S460226. |
| [7] | KIM J, LEE S K, KIM D, et al. Adipose tissue LECT2 expression is associated with obesity and insulin resistance in Korean women[J]. Obesity(Silver Spring), 2022, 30(7):1430-1441. doi:10.1002/oby.23445. |
| [8] | 中华医学会糖尿病学分会. 中国2型糖尿病防治指南(2020年版)[J]. 中华糖尿病杂志, 2021, 13(4):315-409. |
| Chinese Diabetes Society. Guideline for the prevention and treatment of type 2 diabetes mellitus in China(2020 edition)[J]. Chinese Journal of Diabetes, 2021, 13(4):315-409. doi:10.3760/cma.j.cn115791-20210221-00095. | |
| [9] | 宋秀霞, 纪立农. 国际糖尿病联盟代谢综合征全球共识定义[J]. 中华糖尿病杂志, 2005, 13(3):178-180. |
| SONG X X, JI L N. International diabetes federation global consensus definition of metabolic syndrome[J]. Chinese Journal of Diabetes, 2005, 13(3):178-180. doi:10.3321/j.issn:1006-6187.2005.03.010. | |
| [10] | 陈绵雄, 林慧, 张菊云, 等. 青年2型糖尿病患者血清25羟维生素D3水平与代谢综合征的关系[J]. 国际内分泌代谢杂志, 2021, 41(6):601-605. |
| CHEN M X, LIN H, ZHANG J Y, et al. Relationship between serum 25-hydroxyvitamin D3 level and the risk of metabolic syndrome in young patients with type 2 diabetes mellitus[J]. International Journal of Endocrinology and Metabolism, 2021, 41(6):601-605. doi:10.3760/cma.j.cn121383-20200606-06016. | |
| [11] | 匡蕾, 戴武, 叶军, 等. 2型糖尿病合并代谢综合征患者血清25(OH)D、γ-GGT、SUA/SCr比值与肥胖体表测量指标、糖脂代谢和胰岛素抵抗的相关性[J]. 现代生物医学进展, 2022, 22(14):2753-2757. |
| KUANG L, DAI W, YE J, et al. Correlation of serum 25(OH)D,γ-GGT,SUA/SCr ratio with body surface measurement of obesity,glucose and lipid metabolism and insulin resistance in patients with type 2 diabetes mellitus complicated with metabolic syndrome[J]. Progressin Modern Biomedicine, 2022, 22(14):2753-2757. doi:10.13241/j.cnki.pmb.2022.14.031. | |
| [12] | BOVOLINI A, GARCIA J, ANDRADE M A, et al. Metabolic syndrome pathophysiology and predisposing factors[J]. Int J Sports Med, 2021, 42(3):199-214. doi:10.1055/a-1263-0898. |
| [13] | ZHOU D, WANG J, LI X. The red blood cell distribution width-albumin ratio was a potential prognostic biomarker for diabetic ketoacidosis[J]. Int J Gen Med, 2021, 14:5375-5380. doi:10.2147/IJGM.S327733. |
| [14] | GUO H, WANG Y, MIAO Y, et al. Red cell distribution width/albumin ratio as a marker for metabolic syndrome:findings from a cross-sectional study[J]. BMC Endocr Disord, 2024, 24(1):227. doi:10.1186/s12902-024-01762-7. |
| [15] | KWAK H, CHO E H, CHO E B, et al. Is FAM19A5 an adipokine? Peripheral FAM19A5 in wild-type,FAM19A5 knockout,and LacZ knockin mice[J]. Mol Cells, 2024, 47(12):100125. doi:10.1016/j.mocell.2024.100125. |
| [16] | WESOLEK A, SKORACKA K, SKRYPNIK K, et al. Assessment of progranulin and FAM19A5 protein blood levels in patients with metabolic syndrome[J]. J Physiol Pharmacol, 2022, 73(1). doi:10.26402/jpp.2022.1.13. |
| [17] | LEE Y B, HWANG H J, KIM J A, et al. Association of serum FAM19A5 with metabolic and vascular risk factors in human subjects with or without type 2 diabetes[J]. Diab Vasc Dis Res, 2019, 16(6):530-538. doi:10.1177/1479164119860746. |
| [18] | ZHENG X, LU J, XIANG S, et al. Elevated serum levels of leukocyte cell-derived chemotaxin 2 are associated with the prevalence of metabolic syndrome[J]. Acta Diabetol, 2024, 61(5):643-655. doi:10.1007/s00592-024-02242-z. |
| [19] | ZHANG Z, ZENG H, LIN J, et al. Circulating LECT2 levels in newly diagnosed type 2 diabetes mellitus and their association with metabolic parameters: an observational study[J]. Medicine(Baltimore), 2018, 97(15):e0354. doi:10.1097/MD.0000000000010354. |
| [20] | 李晶, 葛旭辉. 血清GGT、SFRP-5、AHSG/APN比值在2型糖尿病合并代谢综合征患者中的意义[J]. 检验医学与临床, 2023, 20(18):2676-2681. |
| LI J, GE X H. Significance of GGT,SFRP-5 and AHSG/APN ratio in patients with type 2 diabetes mellitus complicating metabolic syndrome[J]. Lab Med Clin, 2023, 20(18):2676-2681. doi:10.3969/j.issn.1672-9455.2023.18.011. |
| Viewed | ||||||
|
Full text |
|
|||||
|
Abstract |
|
|||||