
Tianjin Medical Journal ›› 2026, Vol. 54 ›› Issue (6): 561-569.doi: 10.11958/20260224
• Cell and Molecular Biology • Next Articles
DONG Qian( ), CHEN Shuhua, ZHANG Fei△()
Received:2026-01-19
Revised:2026-02-13
Published:2026-06-15
Online:2026-06-15
Contact:
△E-mail:feizhang03@tmu.edu.cn
DONG Qian, CHEN Shuhua, ZHANG Fei. Research on the role of ACE2 in drug resistance of colorectal cancer and its predictive vaule[J]. Tianjin Medical Journal, 2026, 54(6): 561-569.
CLC Number:
| 基因名称 | 引物序列(5'→3') | 产物大小/bp |
|---|---|---|
| ACE2 | 上游:GTGCACAAAGGTGACAATGG | 160 |
| 下游:GGCTGCAGAAAGTGACATGA | ||
| β-actin | 上游:CTGGGTGTTGAAGGTCTC | 216 |
| 下游:CAGAGCAAGAGAGGCATCC |
Tab.1 Primer sequences for qPCR analysis
| 基因名称 | 引物序列(5'→3') | 产物大小/bp |
|---|---|---|
| ACE2 | 上游:GTGCACAAAGGTGACAATGG | 160 |
| 下游:GGCTGCAGAAAGTGACATGA | ||
| β-actin | 上游:CTGGGTGTTGAAGGTCTC | 216 |
| 下游:CAGAGCAAGAGAGGCATCC |
| 引物名称 | 序列(5'→3') |
|---|---|
| siACE2#1 | 上游:GCGAGUGGCUAAUUUGAAATT |
| 下游:UUUCAAAUUAGCCACUCGCTT | |
| siACE2#2 | 上游:GGACAAGUUUAACCACGAATT |
| 下游:UUCGUGGUUAAACUUGUCCTT |
Tab.2 Sequence of siRNA specifically targeting ACE2
| 引物名称 | 序列(5'→3') |
|---|---|
| siACE2#1 | 上游:GCGAGUGGCUAAUUUGAAATT |
| 下游:UUUCAAAUUAGCCACUCGCTT | |
| siACE2#2 | 上游:GGACAAGUUUAACCACGAATT |
| 下游:UUCGUGGUUAAACUUGUCCTT |
| 组别 | n | 年龄/岁 | 化疗反应 | 手术 | 复发 | 转移 | |||||||||
|---|---|---|---|---|---|---|---|---|---|---|---|---|---|---|---|
| 耐药 | 敏感 | ||||||||||||||
| ACE2低表达组 | 47 | 64.00(59.00,72.00) | 6(12.80) | 41(87.20) | 29(61.70) | 1(2.10) | 18(38.30) | ||||||||
| ACE2高表达组 | 46 | 63.50(56.75,67.50) | 38(82.60) | 8(14.70) | 31(67.40) | 0(0.00) | 17(37.00) | ||||||||
| Z或χ2 | 1.181 | 45.492** | 0.329 | 0.989 | 0.018 | ||||||||||
| 组别 | 肿瘤分级 | T分期 | N分期 | M分期 | |||||||||||
| Ⅰ级 | Ⅱ—Ⅲ级 | T1—T2 | T3—T4 | N0 | N1—N3 | M0 | MX | ||||||||
| ACE2低表达组 | 12(25.50) | 35(74.50) | 13(27.70) | 34(72.30) | 29(61.70) | 18(38.30) | 28(59.60) | 19(40.40) | |||||||
| ACE2高表达组 | 14(30.40) | 32(69.60) | 14(30.40) | 32(69.60) | 28(60.90) | 18(39.10) | 28(60.90) | 18(39.10) | |||||||
| χ2 | 0.277 | 0.087 | 0.007 | 0.016 | |||||||||||
Tab.3 Comparison of clinical and pathological characteristics of colorectal cancer patients between the ACE2 high-expression group and the ACE2 low- expression group
| 组别 | n | 年龄/岁 | 化疗反应 | 手术 | 复发 | 转移 | |||||||||
|---|---|---|---|---|---|---|---|---|---|---|---|---|---|---|---|
| 耐药 | 敏感 | ||||||||||||||
| ACE2低表达组 | 47 | 64.00(59.00,72.00) | 6(12.80) | 41(87.20) | 29(61.70) | 1(2.10) | 18(38.30) | ||||||||
| ACE2高表达组 | 46 | 63.50(56.75,67.50) | 38(82.60) | 8(14.70) | 31(67.40) | 0(0.00) | 17(37.00) | ||||||||
| Z或χ2 | 1.181 | 45.492** | 0.329 | 0.989 | 0.018 | ||||||||||
| 组别 | 肿瘤分级 | T分期 | N分期 | M分期 | |||||||||||
| Ⅰ级 | Ⅱ—Ⅲ级 | T1—T2 | T3—T4 | N0 | N1—N3 | M0 | MX | ||||||||
| ACE2低表达组 | 12(25.50) | 35(74.50) | 13(27.70) | 34(72.30) | 29(61.70) | 18(38.30) | 28(59.60) | 19(40.40) | |||||||
| ACE2高表达组 | 14(30.40) | 32(69.60) | 14(30.40) | 32(69.60) | 28(60.90) | 18(39.10) | 28(60.90) | 18(39.10) | |||||||
| χ2 | 0.277 | 0.087 | 0.007 | 0.016 | |||||||||||
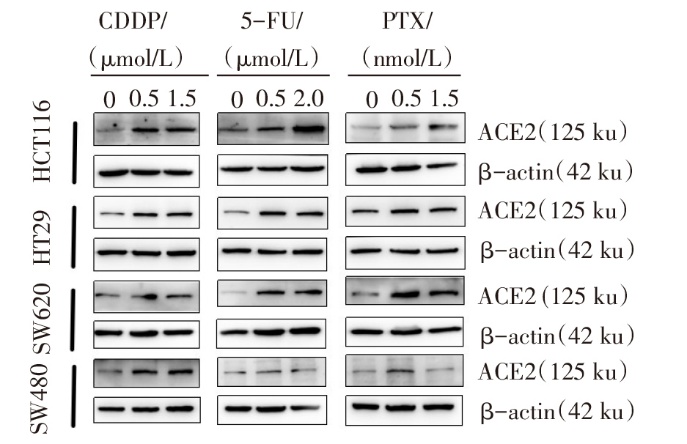
Fig.1 Western blot assay showing ACE2 expression levels in response to various chemotherapeutic drugs and concentrations across a panel of cell lines
| 组别 | HCT116 | HT29 | SW620 | SW480 |
|---|---|---|---|---|
| CDDP对照组 | 0.09±0.01 | 0.28±0.02 | 0.37±0.02 | 0.31±0.03 |
| CDDP 0.5 μmol/L组 | 0.17±0.01a | 0.65±0.03a | 0.53±0.04a | 0.58±0.04a |
| CDDP 1.5 μmol/L组 | 0.18±0.01a | 0.65±0.04a | 0.54±0.05a | 0.61±0.06a |
| F | 68.570** | 104.800** | 11.790** | 26.140** |
| 5-FU对照组 | 0.63±0.06 | 0.30±0.04 | 0.16±0.02 | 0.26±0.03 |
| 5-FU 0.5 μmol/L组 | 0.99±0.08a | 0.91±0.07a | 0.58±0.06a | 0.41±0.04a |
| 5-FU 2.0 μmol/L组 | 1.32±0.10ab | 0.78±0.08a | 0.57±0.08a | 0.73±0.07ab |
| F | 38.160** | 46.060** | 36.000** | 45.780** |
| PTX对照组 | 0.28±0.03 | 0.61±0.06 | 0.26±0.03 | 0.31±0.03 |
| PTX 0.5 nmol/L组 | 0.56±0.07a | 0.94±0.09a | 0.77±0.10a | 0.58±0.07a |
| PTX 1.5 nmol/L组 | 0.98±0.11ab | 0.82±0.06a | 0.74±0.08a | 0.45±0.12 |
| F | 44.370** | 10.180* | 27.200** | 5.620* |
Tab.4 Comparison of ACE2 protein expression levels between different chemotherapy drug concentration groups of each cell line
| 组别 | HCT116 | HT29 | SW620 | SW480 |
|---|---|---|---|---|
| CDDP对照组 | 0.09±0.01 | 0.28±0.02 | 0.37±0.02 | 0.31±0.03 |
| CDDP 0.5 μmol/L组 | 0.17±0.01a | 0.65±0.03a | 0.53±0.04a | 0.58±0.04a |
| CDDP 1.5 μmol/L组 | 0.18±0.01a | 0.65±0.04a | 0.54±0.05a | 0.61±0.06a |
| F | 68.570** | 104.800** | 11.790** | 26.140** |
| 5-FU对照组 | 0.63±0.06 | 0.30±0.04 | 0.16±0.02 | 0.26±0.03 |
| 5-FU 0.5 μmol/L组 | 0.99±0.08a | 0.91±0.07a | 0.58±0.06a | 0.41±0.04a |
| 5-FU 2.0 μmol/L组 | 1.32±0.10ab | 0.78±0.08a | 0.57±0.08a | 0.73±0.07ab |
| F | 38.160** | 46.060** | 36.000** | 45.780** |
| PTX对照组 | 0.28±0.03 | 0.61±0.06 | 0.26±0.03 | 0.31±0.03 |
| PTX 0.5 nmol/L组 | 0.56±0.07a | 0.94±0.09a | 0.77±0.10a | 0.58±0.07a |
| PTX 1.5 nmol/L组 | 0.98±0.11ab | 0.82±0.06a | 0.74±0.08a | 0.45±0.12 |
| F | 44.370** | 10.180* | 27.200** | 5.620* |
| 组别 | HCT116 | SW620 |
|---|---|---|
| CDDP对照组 | 1.00±0.04 | 1.01±0.13 |
| CDDP 0.5 μmol/L组 | 2.68±0.20a | 1.84±0.13a |
| CDDP 1.0 μmol/L组 | 2.93±0.04a | 0.79±0.08b |
| F | 146.800** | 45.080** |
| 5-FU对照组 | 1.00±0.04 | 1.01±0.13 |
| 5-FU 0.5 μmol/L组 | 2.69±0.02a | 1.75±0.32 |
| 5-FU 1.0 μmol/L组 | 2.96±0.57a | 6.67±1.21ab |
| F | 20.710** | 36.150** |
| PTX对照组 | 1.00±0.04 | 1.01±0.13 |
| PTX 0.5 nmol/L组 | 1.04±0.26 | 2.05±0.13a |
| PTX 1.0 nmol/L组 | 15.71±3.96ab | 2.16±0.40a |
| F | 27.380** | 12.330** |
Tab.5 Comparison of ACE2 mRNA expression levels between cell lines treated with varying concentrations of chemotherapeutic drugs
| 组别 | HCT116 | SW620 |
|---|---|---|
| CDDP对照组 | 1.00±0.04 | 1.01±0.13 |
| CDDP 0.5 μmol/L组 | 2.68±0.20a | 1.84±0.13a |
| CDDP 1.0 μmol/L组 | 2.93±0.04a | 0.79±0.08b |
| F | 146.800** | 45.080** |
| 5-FU对照组 | 1.00±0.04 | 1.01±0.13 |
| 5-FU 0.5 μmol/L组 | 2.69±0.02a | 1.75±0.32 |
| 5-FU 1.0 μmol/L组 | 2.96±0.57a | 6.67±1.21ab |
| F | 20.710** | 36.150** |
| PTX对照组 | 1.00±0.04 | 1.01±0.13 |
| PTX 0.5 nmol/L组 | 1.04±0.26 | 2.05±0.13a |
| PTX 1.0 nmol/L组 | 15.71±3.96ab | 2.16±0.40a |
| F | 27.380** | 12.330** |
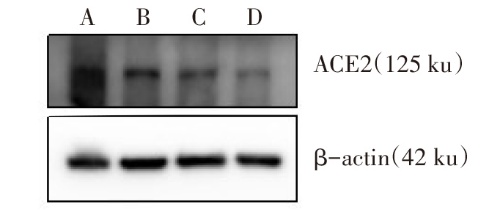
Fig.2 Protein expression levels of ACE2 in four colorectal cancer cell lines
| 组别 | HCT116 | HT29 | SW620 |
|---|---|---|---|
| siControl组 | 0.79±0.06 | 0.52±0.05 | 0.62±0.06 |
| siACE2#1组 | 0.52±0.06a | 0.18±0.02a | 0.41±0.05a |
| siACE2#2组 | 0.46±0.06a | 0.12±0.01a | 0.37±0.03a |
| F | 16.800** | 95.040** | 15.010** |
Tab.6 Comparison of ACE2 protein levels in different cell lines between the ACE2 knockdown groups
| 组别 | HCT116 | HT29 | SW620 |
|---|---|---|---|
| siControl组 | 0.79±0.06 | 0.52±0.05 | 0.62±0.06 |
| siACE2#1组 | 0.52±0.06a | 0.18±0.02a | 0.41±0.05a |
| siACE2#2组 | 0.46±0.06a | 0.12±0.01a | 0.37±0.03a |
| F | 16.800** | 95.040** | 15.010** |
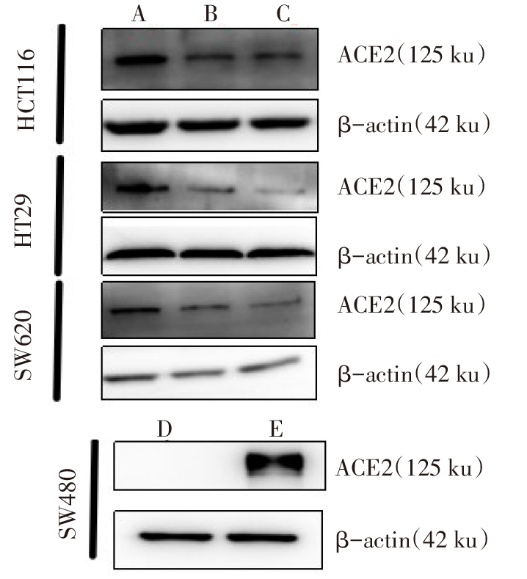
Fig.3 Western blot validation of ACE2 knockdown and overexpression efficiency
| 组别 | CDDP/(μmol/L) | 5-FU/(μmol/L) | PTX/(nmol/L) |
|---|---|---|---|
| HCT116 siControl组 | 11.44(10.22~12.74) | 20.94(18.39~23.79) | 9.26(6.88~12.37) |
| HCT116 siACE2 #1组 | 5.58(4.70~6.63)a | 12.36(10.32~14.77)a | 4.42(3.13~6.14)a |
| HCT116 siACE2 #2组 | 6.56(5.86~7.35)a | 12.77(11.07~14.71)a | 4.85(3.41~6.88)a |
| F | 29.800** | 31.850** | 10.390* |
| HT29 siControl组 | 18.59(13.98~23.78) | 14.88(9.43~21.36) | 5.53(4.86~6.27) |
| HT29 siACE2 #1组 | 7.33(5.83~9.22)a | 6.45(3.69~9.88)a | 4.25(3.63~4.97)a |
| HT29 siACE2 #2组 | 5.27(3.80~7.31)a | 5.46(3.58~7.83)a | 4.19(3.52~4.98)a |
| F | 210.200** | 49.610** | 5.560* |
| SW620 siControl组 | 15.45(14.06~16.96) | 13.76(11.72~16.00) | 6.93(5.79~8.29) |
| SW620 siACE2 #1组 | 7.21(6.04~8.61)a | 8.16(6.73~9.80)a | 3.76(3.33~4.25)a |
| SW620 siACE2 #2组 | 7.06(6.28~7.91)a | 8.91(7.66~10.31)a | 3.92(3.45~4.46)a |
| F | 509.900** | 21.270** | 26.820** |
| SW480 PCDH Control组 | 2.62(2.35~2.91) | 3.88(3.32~4.53) | 19.56(16.32~23.24) |
| SW480 PCDH ACE2组 | 4.82(4.41~5.26) | 9.88(8.09~12.02) | 65.37(55.04~77.61) |
| t | 11.050** | 6.870* | 5.050* |
Tab.7 Comparison of IC50 changes for chemotherapeutic drugs in colorectal cancer cells before and after ACE2 knockdown or overexpression
| 组别 | CDDP/(μmol/L) | 5-FU/(μmol/L) | PTX/(nmol/L) |
|---|---|---|---|
| HCT116 siControl组 | 11.44(10.22~12.74) | 20.94(18.39~23.79) | 9.26(6.88~12.37) |
| HCT116 siACE2 #1组 | 5.58(4.70~6.63)a | 12.36(10.32~14.77)a | 4.42(3.13~6.14)a |
| HCT116 siACE2 #2组 | 6.56(5.86~7.35)a | 12.77(11.07~14.71)a | 4.85(3.41~6.88)a |
| F | 29.800** | 31.850** | 10.390* |
| HT29 siControl组 | 18.59(13.98~23.78) | 14.88(9.43~21.36) | 5.53(4.86~6.27) |
| HT29 siACE2 #1组 | 7.33(5.83~9.22)a | 6.45(3.69~9.88)a | 4.25(3.63~4.97)a |
| HT29 siACE2 #2组 | 5.27(3.80~7.31)a | 5.46(3.58~7.83)a | 4.19(3.52~4.98)a |
| F | 210.200** | 49.610** | 5.560* |
| SW620 siControl组 | 15.45(14.06~16.96) | 13.76(11.72~16.00) | 6.93(5.79~8.29) |
| SW620 siACE2 #1组 | 7.21(6.04~8.61)a | 8.16(6.73~9.80)a | 3.76(3.33~4.25)a |
| SW620 siACE2 #2组 | 7.06(6.28~7.91)a | 8.91(7.66~10.31)a | 3.92(3.45~4.46)a |
| F | 509.900** | 21.270** | 26.820** |
| SW480 PCDH Control组 | 2.62(2.35~2.91) | 3.88(3.32~4.53) | 19.56(16.32~23.24) |
| SW480 PCDH ACE2组 | 4.82(4.41~5.26) | 9.88(8.09~12.02) | 65.37(55.04~77.61) |
| t | 11.050** | 6.870* | 5.050* |
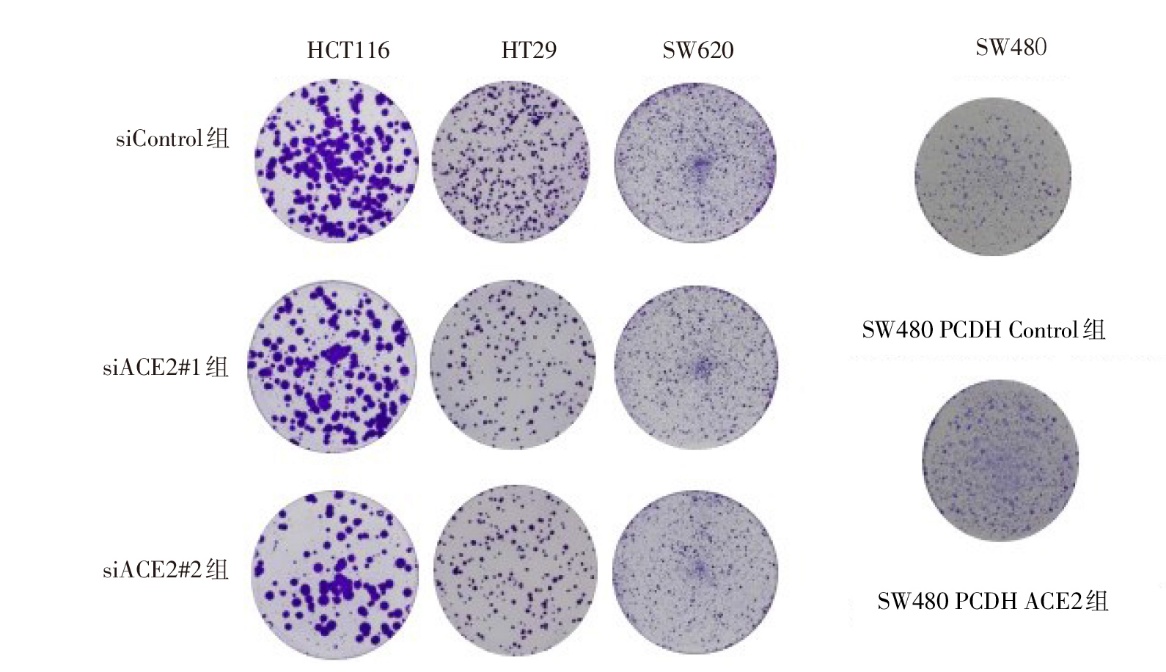
Fig.4 Plate clone formation results of ACE2 knockdown and overexpression in different cell line models
| 组别 | 24 h | 48 h | 72 h | 96 h | 120 h |
|---|---|---|---|---|---|
| HCT116 siControl组 | 0.48±0.01 | 0.86±0.03 | 2.09±0.08 | 3.35±0.02 | 3.48±0.05 |
| HCT116 siACE2#1组 | 0.50±0.02 | 0.71±0.02a | 1.81±0.02a | 2.88±0.04a | 2.99±0.05a |
| HCT116 siACE2#2组 | 0.50±0.02 | 0.74±0.02a | 1.75±0.02a | 2.83±0.09a | 2.92±0.08a |
| F | 2.400 | 33.400** | 44.690** | 77.840** | 72.530** |
| HT29 siControl组 | 0.52±0.04 | 0.81±0.07 | 2.01±0.06 | 2.27±0.01 | 3.15±0.07 |
| HT29 siACE2#1组 | 0.51±0.01 | 0.57±0.03a | 1.54±0.10a | 1.86±0.05a | 2.55±0.03a |
| HT29 siACE2#2组 | 0.46±0.03 | 0.49±0.02a | 1.22±0.08a | 1.52±0.07a | 2.02±0.10a |
| F | 3.350 | 35.520** | 72.440** | 190.700** | 184.900** |
| SW620 siControl组 | 0.41±0.01 | 0.81±0.02 | 1.90±0.01 | 2.71±0.05 | 3.36±0.05 |
| SW620 siACE2#1组 | 0.40±0.01 | 0.69±0.03a | 1.48±0.03a | 2.00±0.07a | 2.66±0.08a |
| SW620 siACE2#2组 | 0.40±0.01 | 0.67±0.02a | 1.40±0.04a | 1.88±0.03a | 2.59±0.04a |
| F | 4.840 | 48.190** | 78.160** | 202.500** | 131.900** |
| SW480 PCDH Control组 | 0.40±0.01 | 0.91±0.05 | 1.93±0.06 | 2.27±0.04 | 3.00±0.04 |
| SW480 PCDH ACE2组 | 0.40±0.04 | 1.10±0.05 | 2.25±0.06 | 2.73±0.04 | 3.41±0.02 |
| t | 0.360 | 4.850** | 6.190** | 15.040** | 14.900** |
Tab.8 Comparison of OD450 values between the ACE2 knockdown or overexpression groups of each cell line and their control groups
| 组别 | 24 h | 48 h | 72 h | 96 h | 120 h |
|---|---|---|---|---|---|
| HCT116 siControl组 | 0.48±0.01 | 0.86±0.03 | 2.09±0.08 | 3.35±0.02 | 3.48±0.05 |
| HCT116 siACE2#1组 | 0.50±0.02 | 0.71±0.02a | 1.81±0.02a | 2.88±0.04a | 2.99±0.05a |
| HCT116 siACE2#2组 | 0.50±0.02 | 0.74±0.02a | 1.75±0.02a | 2.83±0.09a | 2.92±0.08a |
| F | 2.400 | 33.400** | 44.690** | 77.840** | 72.530** |
| HT29 siControl组 | 0.52±0.04 | 0.81±0.07 | 2.01±0.06 | 2.27±0.01 | 3.15±0.07 |
| HT29 siACE2#1组 | 0.51±0.01 | 0.57±0.03a | 1.54±0.10a | 1.86±0.05a | 2.55±0.03a |
| HT29 siACE2#2组 | 0.46±0.03 | 0.49±0.02a | 1.22±0.08a | 1.52±0.07a | 2.02±0.10a |
| F | 3.350 | 35.520** | 72.440** | 190.700** | 184.900** |
| SW620 siControl组 | 0.41±0.01 | 0.81±0.02 | 1.90±0.01 | 2.71±0.05 | 3.36±0.05 |
| SW620 siACE2#1组 | 0.40±0.01 | 0.69±0.03a | 1.48±0.03a | 2.00±0.07a | 2.66±0.08a |
| SW620 siACE2#2组 | 0.40±0.01 | 0.67±0.02a | 1.40±0.04a | 1.88±0.03a | 2.59±0.04a |
| F | 4.840 | 48.190** | 78.160** | 202.500** | 131.900** |
| SW480 PCDH Control组 | 0.40±0.01 | 0.91±0.05 | 1.93±0.06 | 2.27±0.04 | 3.00±0.04 |
| SW480 PCDH ACE2组 | 0.40±0.04 | 1.10±0.05 | 2.25±0.06 | 2.73±0.04 | 3.41±0.02 |
| t | 0.360 | 4.850** | 6.190** | 15.040** | 14.900** |
| 组别 | HCT116 | HT29 | SW620 |
|---|---|---|---|
| siControl组 | 193.67±12.26 | 244.67±12.66 | 253.33±10.53 |
| siACE2#1组 | 144.33±6.13a | 120.00±11.58a | 170.33±10.53a |
| siACE2#2组 | 96.67±8.65a | 142.67±11.32a | 134.00±8.83a |
| F | 53.740** | 62.630** | 74.890** |
Tab.9 Comparison of clone formation counts between the ACE2 knockdown groups of each cell line and their control groups
| 组别 | HCT116 | HT29 | SW620 |
|---|---|---|---|
| siControl组 | 193.67±12.26 | 244.67±12.66 | 253.33±10.53 |
| siACE2#1组 | 144.33±6.13a | 120.00±11.58a | 170.33±10.53a |
| siACE2#2组 | 96.67±8.65a | 142.67±11.32a | 134.00±8.83a |
| F | 53.740** | 62.630** | 74.890** |
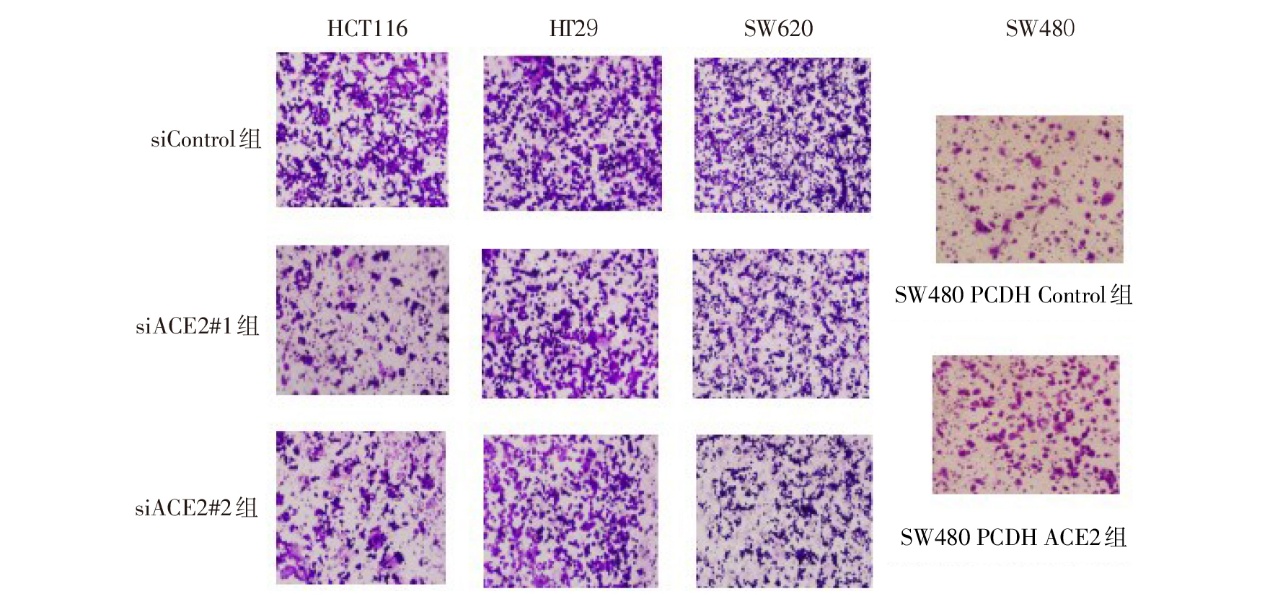
Fig.5 Migration assay results of ACE2 knockdown and overexpression in different cell line models (crystal violet staining, ×200)
| 组别 | HCT116 | HT29 | SW620 |
|---|---|---|---|
| siControl组 | 399.33±124.08 | 592.00±11.05 | 617.00±23.04 |
| siACE2#1组 | 103.67±7.04a | 493.67±10.96a | 411.00±10.71a |
| siACE2#2组 | 148.33±7.72a | 395.67±11.90a | 383.67±11.95a |
| F | 495.900** | 150.700** | 123.900** |
Tab.10 Comparison of migration counts between the ACE2 knockdown group and the control group
| 组别 | HCT116 | HT29 | SW620 |
|---|---|---|---|
| siControl组 | 399.33±124.08 | 592.00±11.05 | 617.00±23.04 |
| siACE2#1组 | 103.67±7.04a | 493.67±10.96a | 411.00±10.71a |
| siACE2#2组 | 148.33±7.72a | 395.67±11.90a | 383.67±11.95a |
| F | 495.900** | 150.700** | 123.900** |
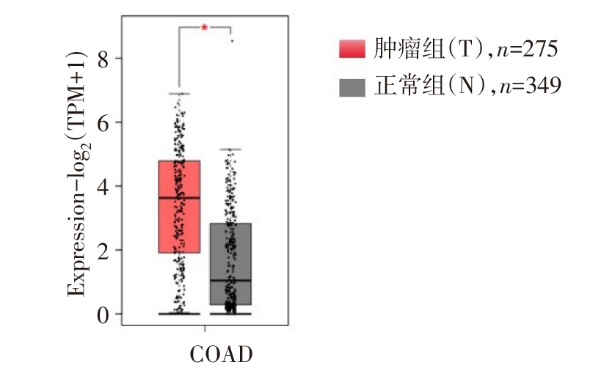
Fig.6 Differential expression of ACE2 in colorectal cancer and normal tissue
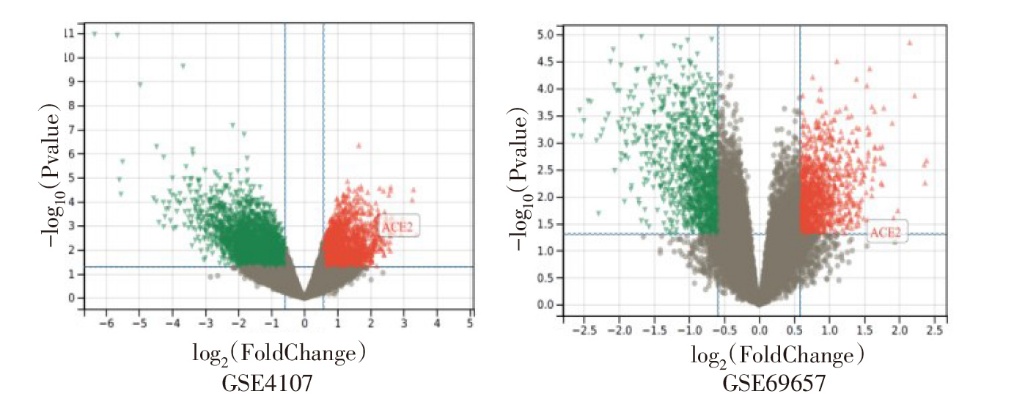
Fig.7 Volcano plot of transcriptome analysis
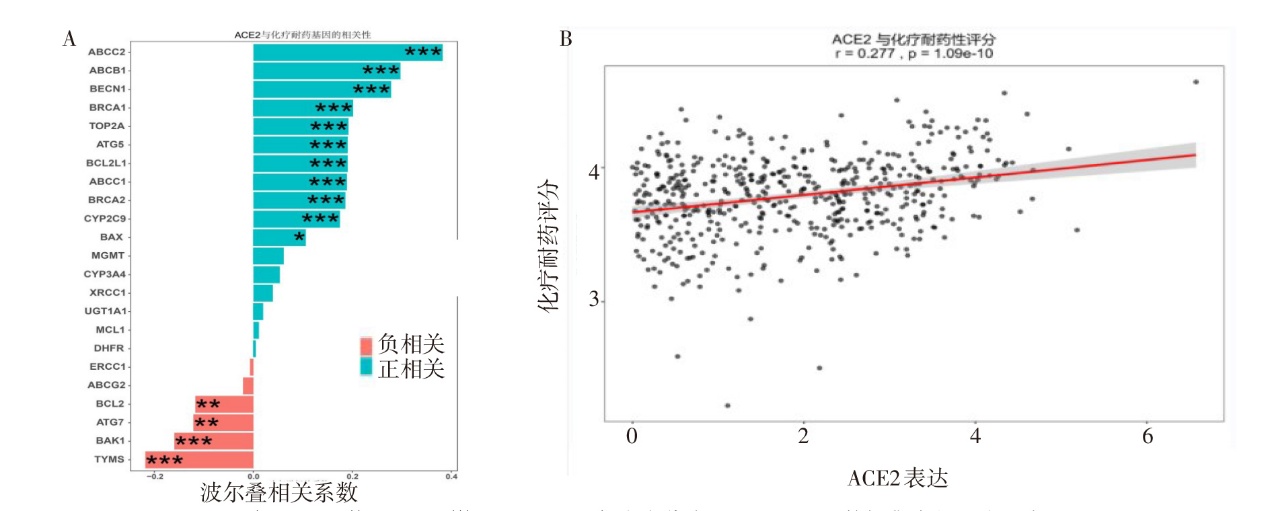
Fig. 8 Correlation analysis of ACE2 expression levels with chemotherapy resistance genes and patient chemotherapy resistance scores
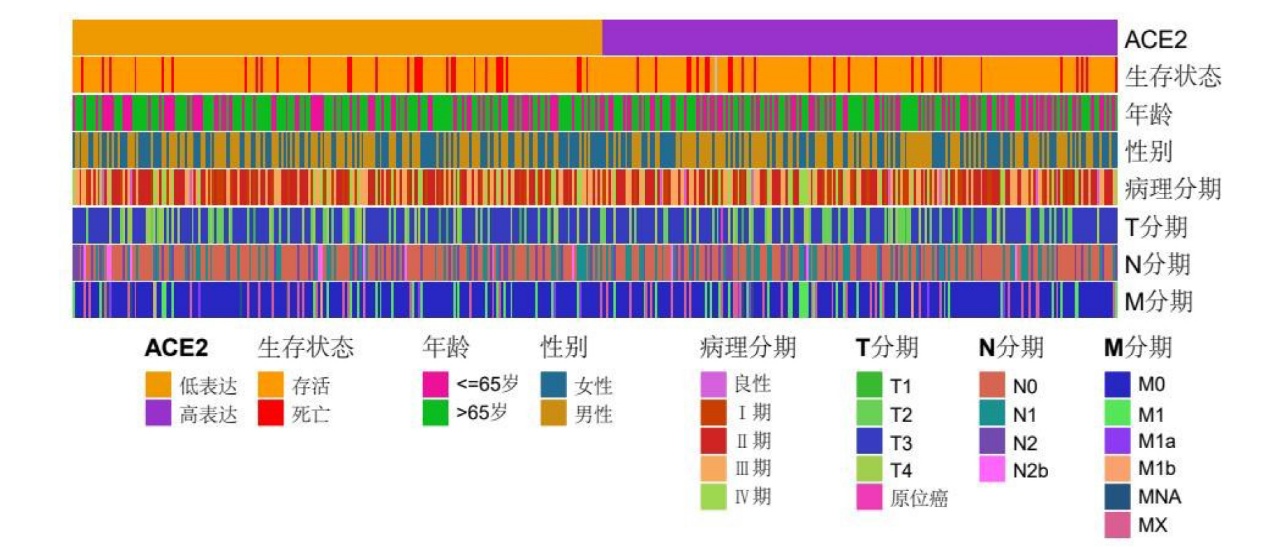
Fig.9 Waffle chart of clinicopathological characteristics in colorectal cancer patients with high versus low ACE2 expression
| 变量 | HR | HR 95%CI | P |
|---|---|---|---|
| ACE2 | 0.899 | 0.454~1.778 | 0.760 |
| 年龄 | 0.976 | 0.920~1.036 | 0.431 |
| T分期(T4 vs. T3) | 5.880 | 1.629~21.224 | 0.007 |
| N分期 | |||
| N1 vs. N0 | 0.757 | 0.083~6.877 | 0.805 |
| N2 vs. N0 | 4.105 | 0.618~27.26 | 0.144 |
| M分期 | |||
| M0 vs. MX | 1.128 | 0.184~6.928 | 0.896 |
| M1 vs. MX | 1.679 | 0.354~7.974 | 0.514 |
| 性别(男 vs. 女) | 3.102 | 0.512~18.794 | 0.218 |
Tab.11 Multivariable Cox regression analysis of ACE2 and clinical variables for overall survival in patients receiving chemotherapy
| 变量 | HR | HR 95%CI | P |
|---|---|---|---|
| ACE2 | 0.899 | 0.454~1.778 | 0.760 |
| 年龄 | 0.976 | 0.920~1.036 | 0.431 |
| T分期(T4 vs. T3) | 5.880 | 1.629~21.224 | 0.007 |
| N分期 | |||
| N1 vs. N0 | 0.757 | 0.083~6.877 | 0.805 |
| N2 vs. N0 | 4.105 | 0.618~27.26 | 0.144 |
| M分期 | |||
| M0 vs. MX | 1.128 | 0.184~6.928 | 0.896 |
| M1 vs. MX | 1.679 | 0.354~7.974 | 0.514 |
| 性别(男 vs. 女) | 3.102 | 0.512~18.794 | 0.218 |
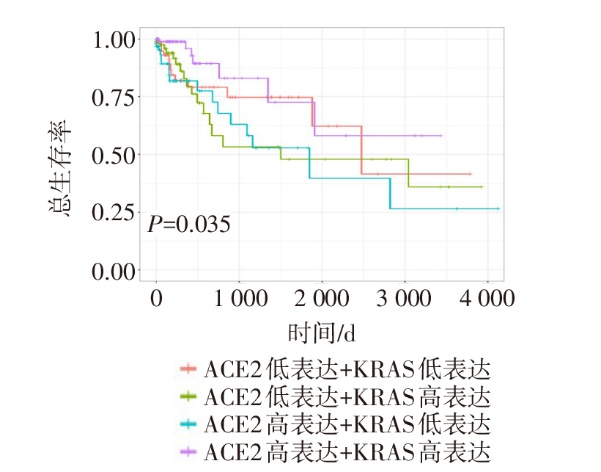
Fig.10 Kaplan?Meier analysis of overall survival stratified by ACE2 and KRAS expression in the TCGA database
| [1] | BADER M, STECKELINGS U M, ALENINA N, et al. Alternative renin-angiotensin system[J]. Hypertension, 2024, 81(5):964-976. doi:10.1161/HYPERTENSIONAHA.123.21364. |
| [2] | TANG X, LU L, LI X, et al. Bridging cancer and COVID-19:The complex interplay of ACE2 and TMPRSS2[J]. Cancer Med, 2025, 14(7):e70829. doi:10.1002/cam4.70829. |
| [3] | IWAI M, HORIUCHI M. Devil and angel in the renin-angiotensin system:ACE-angiotensin II-AT1 receptor axis vs. ACE2-angiotensin-(1-7)-Mas receptor axis[J]. Hypertens Res, 2009, 32(7):533-536. doi:10.1038/hr.2009.74. |
| [4] | TIKELLIS C, BERNARDI S, BURNS W C. Angiotensin-converting enzyme 2 is a key modulator of the renin-angiotensin system in cardiovascular and renal disease[J]. Curr Opin Nephrol Hypertens, 2011, 20(1):62-68. doi:10.1097/MNH.0b013e328341164a. |
| [5] | BEYERSTEDT S, CASARO E B, RANGEL É B. COVID-19:angiotensin-converting enzyme 2(ACE2)expression and tissue susceptibility to SARS-CoV-2 infection[J]. Eur J Clin Microbiol Infect Dis, 2021, 40(5):905-919. doi:10.1007/s10096-020-04138-6. |
| [6] | XI Y, XU P. Global colorectal cancer burden in 2020 and projections to 2040[J]. Transl Oncol, 2021, 14(10):101174. doi:10.1016/j.tranon.2021.101174. |
| [7] | LI Q, ODURO P K, GUO R, et al. Oncolytic viruses:Immunotherapy drugs for gastrointestinal malignant tumors[J]. Front Cell Infect Microbiol, 2022, 12:921534. doi:10.3389/fcimb.2022.921534. |
| [8] | ZHANG Q, LU S, LI T, et al. ACE2 inhibits breast cancer angiogenesis via suppressing the VEGFa/VEGFR2/ERK pathway[J]. J Exp Clin Cancer Res, 2019, 38(1):173. doi:10.1186/s13046-019-1156-5. |
| [9] | RAGO V, BOSSIO S, LOFARO D, et al. New insights into the link between SARS-CoV-2 infection and renal cancer[J]. Life(Basel), 2023, 14(1):52. doi:10.3390/life14010052. |
| [10] | HASSANI B, ATTAR Z, FIROUZABADI N. The renin-angiotensin-aldosterone system(RAAS)signaling pathways and cancer:foes versus allies[J]. Cancer Cell Int, 2023, 23(1):254. doi:10.1186/s12935-023-03080-9. |
| [11] | AHMADI M, PASHANGZADEH S, MOUSAVI P, et al. ACE2 correlates with immune infiltrates in colon adenocarcinoma:Implication for COVID-19[J]. Int Immunopharmacol, 2021, 95:107568. doi:10.1016/j.intimp.2021.107568. |
| [12] | CHOONG O K, JAKOBSSON R, BERGDAHL A G, et al. SARS-CoV-2 replicates and displays oncolytic properties in clear cell and papillary renal cell carcinoma[J]. PLoS One, 2023, 18(1):e0279578. doi:10.1371/journal.pone.0279578. |
| [13] | KUNVARIYA A D, DAVE S A, MODI Z J, et al. Exploration of multifaceted molecular mechanism of angiotensin-converting enzyme 2(ACE2)in pathogenesis of various diseases[J]. Heliyon, 2023, 9(5):e15644. doi:10.1016/j.heliyon.2023.e15644. |
| [14] | DONG F, LI H, LIU L, et al. ACE2 negatively regulates the Warburg effect and suppresses hepatocellular carcinoma progression via reducing ROS-HIF1α activity[J]. Int J Biol Sci, 2023, 19(8):2613-2629. doi:10.7150/ijbs.81498. |
| [15] | WU D, DING Y, WANG T, et al. Significance of tumor-infiltrating immune cells in the prognosis of colon cancer[J]. Onco Targets Ther, 2020, 13:4581-4589. doi:10.2147/OTT.S250416. |
| [16] | ZUO X, REN S, ZHANG H, et al. Chemotherapy induces ACE2 expression in breast cancer via the ROS-AKT-HIF-1α signaling pathway:a potential prognostic marker for breast cancer patients receiving chemotherapy[J]. J Transl Med, 2022, 20(1):509. doi:10.1186/s12967-022-03716-w. |
| [17] | ZHANG S, KAPOOR S, TRIPATHI C, et al. Targeting ACE2-BRD4 crosstalk in colorectal cancer and the deregulation of DNA repair and apoptosis[J]. NPJ Precis Oncol, 2023, 7(1):20. doi:10.1038/s41698-023-00361-4. |
| [18] | KIM D E, OH H J, KIM H J, et al. Synergistic two-step inhibition approach using a combination of trametinib and onvansertib in KRAS and TP53-mutated colorectal adenocarcinoma[J]. Biomed Pharmacother, 2025, 182:117796. doi:10.1016/j.biopha.2024.117796. |
| [19] | HUANG L, GUO Z, WANG F, et al. KRAS mutation:from undruggable to druggable in cancer[J]. Signal Transduct Target Ther, 2021, 6(1):386. doi:10.1038/s41392-021-00780-4. |
| Viewed | ||||||
|
Full text |
|
|||||
|
Abstract |
|
|||||
