
Tianjin Medical Journal ›› 2026, Vol. 54 ›› Issue (10): 1065-1070.doi: 10.11958/20253588
• Clinical Research • Previous Articles Next Articles
YU Guijun1( ), WEI Suping2,△(), LI Linsong3, ZHANG Hongwei4, ZHAO Ruiling5
Received:2025-12-11
Revised:2026-03-17
Published:2026-10-15
Online:2026-10-10
Contact:
△E-mail:weisupingwsp@sina.com
YU Guijun, WEI Suping, LI Linsong, ZHANG Hongwei, ZHAO Ruiling. The relationship between serum ApoB/ApoA-1, urinary microalbumin and the severity of diabetic macular edema[J]. Tianjin Medical Journal, 2026, 54(10): 1065-1070.
CLC Number:
| 组别 | n | ApoB/ApoA-1 | mAlb/(mg/L) |
|---|---|---|---|
| 轻度组 | 74 | 1.07±0.11 | 56.51±10.11 |
| 中度组 | 83 | 1.18±0.15a | 83.29±20.30a |
| 重度组 | 71 | 1.29±0.22ab | 132.72±31.43ab |
| F | 33.277** | 220.558** |
Tab.1 Comparison of ApoB/ApoA-1 ratios and mAlb levels between the mild group, the moderate group and the severe group
| 组别 | n | ApoB/ApoA-1 | mAlb/(mg/L) |
|---|---|---|---|
| 轻度组 | 74 | 1.07±0.11 | 56.51±10.11 |
| 中度组 | 83 | 1.18±0.15a | 83.29±20.30a |
| 重度组 | 71 | 1.29±0.22ab | 132.72±31.43ab |
| F | 33.277** | 220.558** |
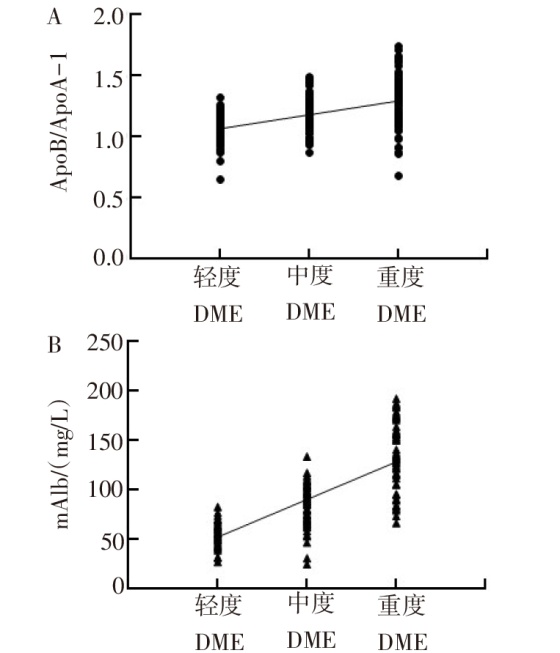
Fig.1 Scatter plot showing the correlation between the ApoB/ApoA-1 ratio, mAlb level and the progression degree of DME
| 组别 | n | 性别 (男/女) | 年龄/ 岁 | 糖尿病 病程/年 | 胰岛素 治疗时间/月 | |||||||||||
|---|---|---|---|---|---|---|---|---|---|---|---|---|---|---|---|---|
| 轻中度组 | 157 | 75/82 | 55.03±6.79 | 15.31±4.38 | 38.28±10.51 | |||||||||||
| 重度组 | 71 | 36/35 | 54.77±7.05 | 17.02±4.44 | 42.68±11.05 | |||||||||||
| t或χ2 | 0.168 | 0.264 | 2.721** | 2.886** | ||||||||||||
| 组别 | 收缩压/ mmHg | 舒张压/ mmHg | BMI/ (kg/m2) | 空腹血糖/ (mmol/L) | ||||||||||||
| 轻中度组 | 136.71±13.06 | 74.69±7.91 | 22.51±2.01 | 10.39±3.11 | ||||||||||||
| 重度组 | 139.20±13.41 | 75.30±8.46 | 22.96±2.03 | 10.40±3.40 | ||||||||||||
| t | 1.322 | 0.519 | 1.528 | 0.044 | ||||||||||||
| 组别 | 餐后2 h血糖/(mmol/L) | ApoB/ ApoA-1 | mAlb/ (mg/L) | HbA1c/ % | ||||||||||||
| 轻中度组 | 14.59±4.59 | 1.16±0.13 | 80.76±16.80 | 9.18±1.84 | ||||||||||||
| 重度组 | 14.81±3.50 | 1.22±0.22 | 110.72±31.43 | 10.33±1.21 | ||||||||||||
| t | 0.398 | 2.128** | 7.557** | 5.532** | ||||||||||||
| 组别 | TC/ (mmol/L) | TG/ (mmol/L) | HDL-C/(mmol/L) | LDL-C/(mmol/L) | ||||||||||||
| 轻中度组 | 5.03±1.04 | 2.38±0.81 | 1.24±0.41 | 3.26±0.91 | ||||||||||||
| 重度组 | 4.96±1.07 | 2.22±0.75 | 1.16±0.35 | 3.28±1.04 | ||||||||||||
| t | 0.535 | 1.333 | 1.234 | 0.147 | ||||||||||||
Tab.2 Comparison of clinical data between the mild to moderate group and the severe group
| 组别 | n | 性别 (男/女) | 年龄/ 岁 | 糖尿病 病程/年 | 胰岛素 治疗时间/月 | |||||||||||
|---|---|---|---|---|---|---|---|---|---|---|---|---|---|---|---|---|
| 轻中度组 | 157 | 75/82 | 55.03±6.79 | 15.31±4.38 | 38.28±10.51 | |||||||||||
| 重度组 | 71 | 36/35 | 54.77±7.05 | 17.02±4.44 | 42.68±11.05 | |||||||||||
| t或χ2 | 0.168 | 0.264 | 2.721** | 2.886** | ||||||||||||
| 组别 | 收缩压/ mmHg | 舒张压/ mmHg | BMI/ (kg/m2) | 空腹血糖/ (mmol/L) | ||||||||||||
| 轻中度组 | 136.71±13.06 | 74.69±7.91 | 22.51±2.01 | 10.39±3.11 | ||||||||||||
| 重度组 | 139.20±13.41 | 75.30±8.46 | 22.96±2.03 | 10.40±3.40 | ||||||||||||
| t | 1.322 | 0.519 | 1.528 | 0.044 | ||||||||||||
| 组别 | 餐后2 h血糖/(mmol/L) | ApoB/ ApoA-1 | mAlb/ (mg/L) | HbA1c/ % | ||||||||||||
| 轻中度组 | 14.59±4.59 | 1.16±0.13 | 80.76±16.80 | 9.18±1.84 | ||||||||||||
| 重度组 | 14.81±3.50 | 1.22±0.22 | 110.72±31.43 | 10.33±1.21 | ||||||||||||
| t | 0.398 | 2.128** | 7.557** | 5.532** | ||||||||||||
| 组别 | TC/ (mmol/L) | TG/ (mmol/L) | HDL-C/(mmol/L) | LDL-C/(mmol/L) | ||||||||||||
| 轻中度组 | 5.03±1.04 | 2.38±0.81 | 1.24±0.41 | 3.26±0.91 | ||||||||||||
| 重度组 | 4.96±1.07 | 2.22±0.75 | 1.16±0.35 | 3.28±1.04 | ||||||||||||
| t | 0.535 | 1.333 | 1.234 | 0.147 | ||||||||||||
| 变量 | β | SE | Wald χ2 | P | OR | OR 95%CI |
|---|---|---|---|---|---|---|
| ApoB/ApoA-1 | 0.061 | 0.012 | 27.437 | <0.001 | 1.062 | 1.039~1.087 |
| mAlb | 0.064 | 0.011 | 32.823 | <0.001 | 1.066 | 1.043~1.090 |
| HbA1c | 0.426 | 0.149 | 8.195 | 0.004 | 1.531 | 1.144~2.049 |
| 糖尿病病程 | 0.178 | 0.053 | 11.268 | 0.001 | 1.195 | 1.077~1.326 |
| 胰岛素治疗时间 | 0.013 | 0.018 | 0.512 | 0.474 | 1.013 | 0.978~1.049 |
| 常数项 | -22.166 | 3.086 | 51.605 | <0.001 | - | - |
Tab.3 Multivariate Logistic regression analysis of factors affecting the development of patients to severe DME
| 变量 | β | SE | Wald χ2 | P | OR | OR 95%CI |
|---|---|---|---|---|---|---|
| ApoB/ApoA-1 | 0.061 | 0.012 | 27.437 | <0.001 | 1.062 | 1.039~1.087 |
| mAlb | 0.064 | 0.011 | 32.823 | <0.001 | 1.066 | 1.043~1.090 |
| HbA1c | 0.426 | 0.149 | 8.195 | 0.004 | 1.531 | 1.144~2.049 |
| 糖尿病病程 | 0.178 | 0.053 | 11.268 | 0.001 | 1.195 | 1.077~1.326 |
| 胰岛素治疗时间 | 0.013 | 0.018 | 0.512 | 0.474 | 1.013 | 0.978~1.049 |
| 常数项 | -22.166 | 3.086 | 51.605 | <0.001 | - | - |
| 变量 | 最佳 截断值 | 敏感度/ % | 特异度/ % | AUC | 95%CI | 约登 指数 |
|---|---|---|---|---|---|---|
| ApoB/ApoA-1 | 1.23 | 78.87 | 73.89 | 0.711 | 0.648~0.769 | 0.528 |
| mAlb | 89.46 mg/L | 67.61 | 79.62 | 0.782 | 0.723~0.834 | 0.472 |
| 联合 | - | 91.55 | 90.45 | 0.927 | 0.885~0.957 | 0.820 |
Tab.4 Diagnostic value of ApoB/ApoA-1 ratio and mAlb level in predicting the development of severe DME in patients
| 变量 | 最佳 截断值 | 敏感度/ % | 特异度/ % | AUC | 95%CI | 约登 指数 |
|---|---|---|---|---|---|---|
| ApoB/ApoA-1 | 1.23 | 78.87 | 73.89 | 0.711 | 0.648~0.769 | 0.528 |
| mAlb | 89.46 mg/L | 67.61 | 79.62 | 0.782 | 0.723~0.834 | 0.472 |
| 联合 | - | 91.55 | 90.45 | 0.927 | 0.885~0.957 | 0.820 |
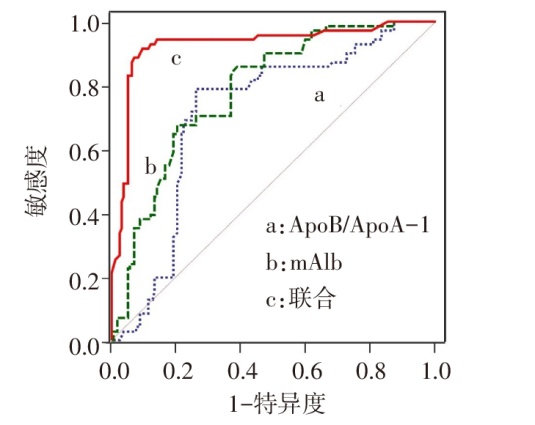
Fig.2 ROC curve of ApoB/ApoA-1 ratio and mAlb level for the development of severe DME
| [1] | Gupta S, Sharma N, Arora S, et al. Diabetes:a review of its pathophysiology,and advanced methods of mitigation[J]. Curr Med Res Opin, 2024, 40(5):773-780. doi:10.1080/03007995.2024.2333440. |
| [2] | Lu Z, Fan B, Li Y, et al. RAGE plays key role in diabetic retinopathy:a review[J]. Biomed Eng Online, 2023, 22(1):128. doi:10.1186/s12938-023-01194-9. |
| [3] | 曾国强, 钟键波, 张怡, 等. 眼内液细胞因子检测在糖尿病黄斑水肿中临床意义的研究进展[J]. 中华眼底病杂志, 2024, 40(8):651-655. |
| Zeng G Q, Zhong J B, Zhang Y, et al. Research progress of clinical importance of detecting cytokines in the intraocular fluid in diabetic macular edema[J]. Chin J Ocul Fundus Dis, 2024, 40(8):651-655. doi:10.3760/cma.j.cn511434-20240305-00090. | |
| [4] | Tatsumi T. Current treatments for diabetic macular edema[J]. Int J Mol Sci, 2023, 24(11):9591. doi:10.3390/ijms24119591. |
| [5] | 魏丹, 安喜燕, 高军, 等. 不同OCT分型糖尿病黄斑水肿发病的影响因素分析[J]. 眼科新进展, 2023, 43(4):313-317. |
| Wei D, An X Y, Gao J, et al. Influencing factors on the attack of different types of diabetic macular edema classified by optical coherence tomography[J]. Recent Advances in Ophthalmology, 2023, 43(4):313-317. doi:10.13389/j.cnki.rao.2023.0064. | |
| [6] | 李建良, 杜红彦, 骆煌, 等. 加味五苓肾气汤治疗糖尿病黄斑水肿的疗效及机制研究[J]. 山东中医杂志, 2024, 43(6):598-602. |
| Li J L, Du H Y, Luo H, et al. Study on therapeutic effect and mechanism of Modified Wuling Shenqi Decoction(加味五苓肾气汤)in treatment of diabetic macular edema[J]. Shandong Journal of Traditional Chinese Medicine, 2024, 43(6):598-602. doi:10.16295/j.cnki.0257-358x.2024.06.008. | |
| [7] | Zhu Y, Dou Z, Wang W, et al. Intravitreal injection of conbercept for diabetic macular edema complicated with diabetic nephropathy[J]. Int J Ophthalmol, 2024, 17(2):304-310. doi:10.18240/ijo.2024.02.12. |
| [8] | 中国医师协会内分泌代谢科医师分会, 国家代谢性疾病临床医学研究中心. 糖尿病分型诊断中国专家共识[J]. 中华糖尿病杂志, 2022, 14(2):120-139. |
| Chinese Medical Doctor Association-Endocrinology and Metabolism Specialty Branch,National Clinical Research Center for Metabolic Diseases. Classification of diabetes mellitus in China:an expert consensus statement[J]. Chin J Diabetes Mellitus, 2022, 14(2):120-139.doi:10.3760/cma.j.cn115791-20211219-00672. | |
| [9] | 邵毅, 王珊珊, 袁晴. 糖尿病黄斑水肿诊治规范—2018欧洲视网膜专家协会指南解读[J]. 国际眼科杂志, 2020, 20(1):1-3. |
| Shao Y, Wang S S, Yuan Q. European Society of Retina Specialists guidelines for management of diabetic macular edema[J]. International Eye Science, 2020, 20(1):1-3. doi:10.3980/j.issn.1672-5123.2020.1.01. | |
| [10] | 阎文平, 弓剑戟. 血清PTX3和FABP4及PHD2水平与糖尿病性黄斑水肿严重程度的相关性[J]. 国际眼科杂志, 2026, 26(1):114-118. |
| Yan W P, Gong J J. Correlation of serum pentraxin 3,fatty acid-binding protein 4 and prolyl hydroxylase 2 levels with the severity of diabetic macular edema[J]. International Eye Science, 2026, 26(1):114-118. doi:10.3980/j.issn.1672-5123.2026.1.20. | |
| [11] | Apostolidi A, Stergiopoulos G, Bellou S, et al. Advances in modeling the inner blood-retinal barrier:from static tissue cell cultures to microphysiological systems[J]. Pharmaceuticals (Basel), 2025, 18(9):1374. doi:10.3390/ph18091374. |
| [12] | Noma H, Yasuda K, Shimura M. Involvement of cytokines in the pathogenesis of diabetic macular edema[J]. Int J Mol Sci, 2021, 22(7):3427. doi:10.3390/ijms22073427. |
| [13] | Paul S, Kim C, Soliman M K, et al. Can the future be bright with advances in diabetic eye care?[J]. Endocrinol Metab Clin North Am, 2023, 52(1):89-99. doi:10.1016/j.ecl.2022.06.004. |
| [14] | Soedarman S, Julia M, Gondhowiardjo T D, et al. Serum apolipoprotein A1 and B are associated with 6-month persistent and incident diabetic macular oedema in type 2 diabetes[J]. BMJ Open Ophthalmol, 2023, 8(1):e001207. doi:10.1136/bmjophth-2022-001207. |
| [15] | 范瑞磊, 魏若愚, 金培新, 等. 尿微量白蛋白/肌酐比值、趋化因子样受体1、血清25-羟胆骨化醇与糖尿病视网膜病变的关系[J]. 安徽医药, 2022, 26(10):2081-2085. |
| Fan R L, Wei R Y, Jin P X, et al. Relationship between urine microalbumin/creatinine ratio,chemokine-like receptor 1,25-hydroxycholecalciferol and diabetic retinopathy[J]. Anhui Medical and Pharmaceutical Journal, 2022, 26(10):2081-2085. doi:10.3969/j.issn.1009-6469.2022.10.040. | |
| [16] | 但玉娇, 张凌, 陈彬. ApoB/ApoA1与糖尿病视网膜病变继发玻璃体积血的相关性研究[J]. 新医学, 2023, 54(10):739-742. |
| Dan Y J, Zhang L, Chen B. Study of the correlation between ApoB/ApoA1 and vitreous hemorrhage secondary to diabetic retinopathy[J]. Journal of New Medicine, 2023, 54(10):739-742. doi:10.3969/j.issn.0253-9802.2023.10.010. | |
| [17] | 朱春明, 鲍延丽. 血清COX-2和RAGE水平对糖尿病视网膜病变的诊断价值[J]. 国际眼科杂志, 2025, 25(6):1009-1013. |
| Zhu C M, Bao Y L. Diagnostic value of serum COX-2 and RAGE for retinopathy of diabetes mellitus[J]. International Eye Science, 2025, 25(6):1009-1013. doi:10.3980/j.issn.1672-5123.2025.6.25. | |
| [18] | Saucedo L, Pfister I B, Zandi S, et al. Ocular TGF-β,matrix metalloproteinases,and TIMP-1 increase with the development and progression of diabetic retinopathy in type 2 diabetes mellitus[J]. Mediators Inflamm, 2021, 2021:9811361. doi:10.1155/2021/9811361. |
| [19] | 方石峰, 马翔, 王永平. HbA1c、mAlb、α1-MG与重度非增殖期糖尿病视网膜病变激光术后并发玻璃体积血的相关性分析[J]. 广西医科大学学报, 2020, 37(8):1537-1541. |
| Fang S F, Ma X, Wang Y P. Correlation analysis between HbA1c,mAlb and α1-MG levels and vitreous hemorrhage complicating severe non-proliferative diabetic retinopathy after laser surgery[J]. Journal of Guangxi Medical University, 2020, 37(8):1537-1541. doi:10.16190/j.cnki.45-1211/r.2020.08.023. | |
| [20] | Hector S, Thulesius H O, Landin-Olsson M, et al. Soluble CD163 and glycated haemoglobin were independently associated with the progression of diabetic retinopathy in adult patients with type 1 diabetes[J]. BMJ Open Ophthalmol, 2023, 8(1):e001314. doi:10.1136/bmjophth-2023-001314. |
| [21] | Trandafir M, Savu O I, Gheorghiu M. The complex immunological alterations in patients with type 2 diabetes mellitus on hemodialysis[J]. J Clin Med, 2024, 13(13):3687. doi:10.3390/jcm13133687. |
| Viewed | ||||||
|
Full text |
|
|||||
|
Abstract |
|
|||||
