Tianjin Medical Journal ›› 2022, Vol. 50 ›› Issue (12): 1297-1301.doi: 10.11958/20220971
• Clinical Research • Previous Articles Next Articles
WANG Junwei( ), SU Yue, NIE Xiuling, ZHAO Wei△()
Received:2022-06-23
Revised:2022-08-03
Published:2022-12-15
Online:2022-12-30
Contact:
ZHAO Wei
E-mail:tangdou0322@qq.com;zhaowei800128@126.com
WANG Junwei, SU Yue, NIE Xiuling, ZHAO Wei. Relationship between blood pressure variability and hyperuricemia in patients with essential hypertension[J]. Tianjin Medical Journal, 2022, 50(12): 1297-1301.
CLC Number:
| 组别 | n | 年龄 (岁) | 男性 | 高血压分级 | BMI (kg/m2) | HbA1c (%) | TC (mmol/L) | HDL-C(mmol/L) | ||||||||||
|---|---|---|---|---|---|---|---|---|---|---|---|---|---|---|---|---|---|---|
| 1级 | 2级 | 3级 | ||||||||||||||||
| 无高尿酸血症组 | 143 | 57.4±10.6 | 99(69.2) | 14(9.8) | 51(35.7) | 78(54.5) | 27.2(24.6,29.7) | 8.1(7.1,9.2) | 4.68(4.08,5.49) | 1.13(0.99,1.28) | ||||||||
| 高尿酸血症组 | 54 | 56.4±11.1 | 45(83.3) | 1(1.9) | 10(18.5) | 43(79.6) | 28.2(26.2,31.2) | 7.2(6.6,8.2) | 5.10(4.18,5.85) | 1.07(0.90,1.21) | ||||||||
| χ2、t或Z | 0.588 | 3.964* | 10.981* | 2.063* | 3.094** | 0.999 | 2.361* | |||||||||||
| 组别 | LDL-C (mmol/L) | TG (mmol/L) | Scr (μmol/L) | BUN (mmol/L) | SUA (μmol/L) | FEUA (%) | eGFR [mL/(min·1.73 m2)] | |||||||||||
| 无高尿酸血症组 | 3.16±0.86 | 1.53(1.04,2.27) | 67.6±14.9 | 5.47(4.38,6.39) | 308.0(264.1,341.9) | 7.0(5.9,8.4) | 116.6±27.4 | |||||||||||
| 高尿酸血症组 | 3.14±0.99 | 2.47(1.58,8.04) | 85.6±19.0 | 5.94(5.10,8.04) | 458.9(422.2,507.8) | 4.9(4.0,6.5) | 91.0±23.9 | |||||||||||
| χ2、t或Z | 0.111 | 4.050** | 7.018** | 3.092** | 9.909** | 6.166** | 6.061** | |||||||||||
Tab.1 Comparison of general clinical data and biochemical indexes between the two groups
| 组别 | n | 年龄 (岁) | 男性 | 高血压分级 | BMI (kg/m2) | HbA1c (%) | TC (mmol/L) | HDL-C(mmol/L) | ||||||||||
|---|---|---|---|---|---|---|---|---|---|---|---|---|---|---|---|---|---|---|
| 1级 | 2级 | 3级 | ||||||||||||||||
| 无高尿酸血症组 | 143 | 57.4±10.6 | 99(69.2) | 14(9.8) | 51(35.7) | 78(54.5) | 27.2(24.6,29.7) | 8.1(7.1,9.2) | 4.68(4.08,5.49) | 1.13(0.99,1.28) | ||||||||
| 高尿酸血症组 | 54 | 56.4±11.1 | 45(83.3) | 1(1.9) | 10(18.5) | 43(79.6) | 28.2(26.2,31.2) | 7.2(6.6,8.2) | 5.10(4.18,5.85) | 1.07(0.90,1.21) | ||||||||
| χ2、t或Z | 0.588 | 3.964* | 10.981* | 2.063* | 3.094** | 0.999 | 2.361* | |||||||||||
| 组别 | LDL-C (mmol/L) | TG (mmol/L) | Scr (μmol/L) | BUN (mmol/L) | SUA (μmol/L) | FEUA (%) | eGFR [mL/(min·1.73 m2)] | |||||||||||
| 无高尿酸血症组 | 3.16±0.86 | 1.53(1.04,2.27) | 67.6±14.9 | 5.47(4.38,6.39) | 308.0(264.1,341.9) | 7.0(5.9,8.4) | 116.6±27.4 | |||||||||||
| 高尿酸血症组 | 3.14±0.99 | 2.47(1.58,8.04) | 85.6±19.0 | 5.94(5.10,8.04) | 458.9(422.2,507.8) | 4.9(4.0,6.5) | 91.0±23.9 | |||||||||||
| χ2、t或Z | 0.111 | 4.050** | 7.018** | 3.092** | 9.909** | 6.166** | 6.061** | |||||||||||
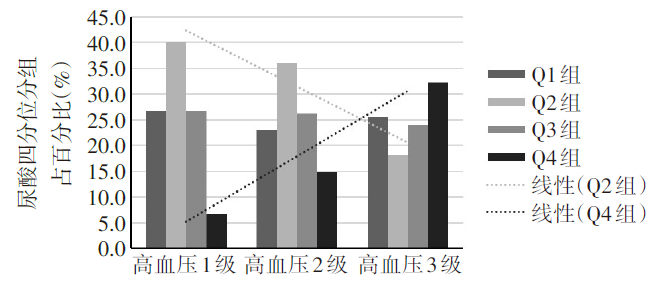
Fig.1 Distribution of serum uric acid levels in different hypertension grades
| 组别 | n | DSBPX (mmHg) | DDBPX (mmHg) | NSBPX (mmHg) | NDBPX (mmHg) | |||||
|---|---|---|---|---|---|---|---|---|---|---|
| 无高尿酸血症组 | 143 | 142±15 | 79±10 | 136±18 | 74±11 | |||||
| 高尿酸血症组 | 54 | 144±17 | 83±13 | 139±18 | 78±13 | |||||
| t或Z | 0.922 | 2.120* | 1.001 | 2.089* | ||||||
| 组别 | SBPwSD | DBPwSD | HRX(次/min) | HRV | ||||||
| 无高尿酸血症组 | 15.4±4.7 | 10.9±3.2 | 73±8 | 7.7(6.2,9.7) | ||||||
| 高尿酸血症组 | 16.7±5.0 | 12.0±3.5 | 76±10 | 8.5(7.3,10.6) | ||||||
| t或Z | 1.656 | 1.978* | 1.733 | 2.043* | ||||||
Tab.2 Comparison of blood pressure related indicators between the two groups
| 组别 | n | DSBPX (mmHg) | DDBPX (mmHg) | NSBPX (mmHg) | NDBPX (mmHg) | |||||
|---|---|---|---|---|---|---|---|---|---|---|
| 无高尿酸血症组 | 143 | 142±15 | 79±10 | 136±18 | 74±11 | |||||
| 高尿酸血症组 | 54 | 144±17 | 83±13 | 139±18 | 78±13 | |||||
| t或Z | 0.922 | 2.120* | 1.001 | 2.089* | ||||||
| 组别 | SBPwSD | DBPwSD | HRX(次/min) | HRV | ||||||
| 无高尿酸血症组 | 15.4±4.7 | 10.9±3.2 | 73±8 | 7.7(6.2,9.7) | ||||||
| 高尿酸血症组 | 16.7±5.0 | 12.0±3.5 | 76±10 | 8.5(7.3,10.6) | ||||||
| t或Z | 1.656 | 1.978* | 1.733 | 2.043* | ||||||
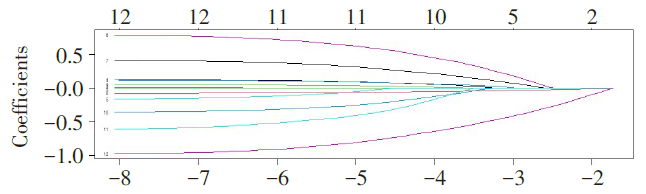
Fig.2 LASSO regression model was used to screen the influencing factors of hyperuricemia
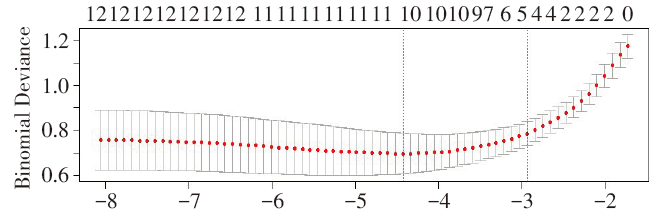
Fig.3 Cross validation plot for the penalty term
| 变量 | β | SE | Wald χ2 | P | OR | OR 95%CI |
|---|---|---|---|---|---|---|
| DBPwSD | 0.158 | 0.072 | 4.891 | 0.027 | 1.172 | 1.018~1.348 |
| TG | 0.430 | 0.129 | 11.127 | 0.001 | 1.537 | 1.194~1.978 |
| eGFR | -0.077 | 0.014 | 30.746 | 0.001 | 0.926 | 0.901~0.951 |
| FEUA | -0.985 | 0.172 | 32.872 | 0.001 | 0.373 | 0.267~0.523 |
| 常数项 | 10.171 | 1.936 | 27.587 | 0.001 | 26 124.755 |
Tab.3 Logistic regression analysis of influencing factors of hyperuricemia
| 变量 | β | SE | Wald χ2 | P | OR | OR 95%CI |
|---|---|---|---|---|---|---|
| DBPwSD | 0.158 | 0.072 | 4.891 | 0.027 | 1.172 | 1.018~1.348 |
| TG | 0.430 | 0.129 | 11.127 | 0.001 | 1.537 | 1.194~1.978 |
| eGFR | -0.077 | 0.014 | 30.746 | 0.001 | 0.926 | 0.901~0.951 |
| FEUA | -0.985 | 0.172 | 32.872 | 0.001 | 0.373 | 0.267~0.523 |
| 常数项 | 10.171 | 1.936 | 27.587 | 0.001 | 26 124.755 |
| [1] | 中国心血管健康与疾病报告编写组. 中国心血管健康与疾病报告2021概要[J]. 中国循环杂志, 2022, 37(6):553-578. |
| The Writing Committee of the Report on Cardiovascular Health and Diseases in China. Report on cardiovascular health and diseases in China 2021:An updated summary[J]. Chinese Circulation Journal, 2022, 37(6):553-578. doi:10.3969/j.issn.1000-3614.2022.06.001. | |
| [2] | LIN K H, YEN F S, CHEN H S, et al. Serum uric acid and blood pressure among adolescents: Data from the Nutrition and Health Survey in Taiwan(NAHSIT)2010-2011[J]. Blood Press, 2021, 30(2):118-125. doi:10.1080/08037051.2020.1848417. |
| [3] | ANDRIKOU I, TSIOUFIS C, DIMITRIADIS K, et al. Uric acid as an independent predictor of coronary artery disease in essential hypertension:Data from an 8-year-follow-up study[J]. Clin Exp Pharmacol Physiol, 2018, 45(8):866-869. doi:10.1111/1440-1681.12928. |
| [4] | SUN P, CHEN M, GUO X, et al. Combined effect of hypertension and hyperuricemia on ischemic stroke in a rural Chinese population[J]. BMC Public Health, 2021, 21(1):776. doi:10.1186/s12889-021-10858-x. |
| [5] | LIU C, QIU D, ZHANG M, et al. Association of hyperuricemia and hypertension phenotypes in hypertensive patients without uric acid lowering treatment[J]. Clin Exp Hypertens, 2021, 43(6):516-521. doi:10.1080/10641963.2021.1907397. |
| [6] | ZONG Q, MA G, WANG T. Uric acid lowering improves insulin sensitivity and lowers blood pressure:A meta-analysis of randomized parallel-controlled clinical trials[J]. Afr Health Sci, 2021, 21(1):82-95. doi:10.4314/ahs.v21i1.13. |
| [7] | PONGPANICH P, PITAKPAIBOONKUL P, TAKKAVATAKARN K, et al. The benefits of angiotensin-converting enzyme inhibitors/angiotensin Ⅱ receptor blockers combined with calcium channel blockers on metabolic,renal,and cardiovascular outcomes in hypertensive patients:A meta-analysis[J]. Int Urol Nephrol, 2018, 50(12):2261-2278. doi:10.1007/s11255-018-1991-x. |
| [8] | SCHUTTE A E, KOLLIAS A, STERGIOU G S. Blood pressure and its variability:Classic and novel measurement techniques[J]. Nat Rev Cardiol, 2022:1-12. doi:10.1038/s41569-022-00690-0. |
| [9] | PARATI G, STERGIOU G S, DOLAN E, et al. Blood pressure variability:Clinical relevance and application[J]. J Clin Hypertens(Greenwich), 2018, 20(7):1133-1137. doi:10.1111/jch.13304. |
| [10] | XU X, BAO H, TIAN Z, et al. Prevalence,awareness,treatment,and control of hypertension in Northern China:A cross-sectional study[J]. BMC Cardiovasc Disord, 2021, 21(1):525. doi:10.1186/s12872-021-02333-7. |
| [11] | ZHANG M, ZHU X, WU J, et al. Prevalence of hyperuricemia among Chinese adults:Findings from two nationally representative cross-sectional surveys in 2015-16 and 2018-19[J]. Front Immunol, 2021, 12:791983. doi:10.3389/fimmu.2021.791983. |
| [12] | 陈蕾, 伍成凯, 康峻鸣, 等. 我国45岁及以上中老年人群高尿酸血症与常见慢性病的关联研究[J]. 中国全科医学, 2021, 24(4):447-452. |
| CHEN L, WU C K, KANG J M, et al. Association of hyperuricemia with common chronic diseases in middle-aged and older people over 45 years in China[J]. Chinese General Practice, 2021, 24(4):447-452. doi:10.12114/j.issn.1007-9572.2020.00.599. | |
| [13] | 杨珂珂, 陈书林, 徐玉梅. 老年高尿酸血症患者急性心肌梗死发生风险预测的模型建立[J]. 中华老年医学杂志, 2021, 40(12):1517-1521. |
| YANG K K, CHEN S L, XU Y M. Establishment of risk prediction model for acute myocardial infarction in elderly patients with hyperuricemia[J]. Chinese Journal of Geriatrics, 2021, 40(12):1517-1521. doi:10.3760/cma.j.issn.0254-9026.2021.12.009. | |
| [14] | WANG J, QIN T, CHEN J, et al. Hyperuricemia and risk of incident hypertension:A systematic review and meta-analysis of observational studies[J]. PLoS One, 2014, 9(12):e114259. doi:10.1371/journal.pone.0114259. |
| [15] | LI Y, SHEN Z, ZHU B, et al. Demographic,regional and temporal trends of hyperuricemia epidemics in mainland China from 2000 to 2019:A systematic review and meta-analysis[J]. Glob Health Action, 2021, 14(1):1874652. doi:10.1080/16549716.2021.1874652. |
| [16] | APPIAH K O, NATH M, MANNING L, et al. Increasing blood pressure variability predicts poor functional outcome following acute stroke[J]. J Stroke Cerebrovasc Dis, 2021, 30(1):105466. doi:10.1016/j.jstrokecerebrovasdis.2020.105466. |
| [17] | BAKKAR N Z, EL-YAZBI A F, ZOUEIN F A, et al. Beat-to-beat blood pressure variability:An early predictor of disease and cardiovascular risk[J]. J Hypertens, 2021, 39(5):830-845. doi:10.1097/HJH.0000000000002733. |
| [18] | MANOUSOPOULOS K, KOROBOKI E, BARLAS G, et al. Association of home and ambulatory blood pressure variability with left ventricular mass index in chronic kidney disease patients[J]. Hypertens Res, 2021, 44(1):55-62. doi:10.1038/s41440-020-0512-3. |
| [19] | CHOWDHURY E K, NELSON M R, WING L, et al. Change in blood pressure variability among treated elderly hypertensive patients and its association with mortality[J]. J Am Heart Assoc, 2019, 8(21):e012630. doi:10.1161/JAHA.119.012630. |
| [20] | DE HAVENON A, ANADANI M, PRABHAKARAN S, et al. Increased blood pressure variability and the risk of probable dementia or mild cognitive impairment:A post hoc analysis of the SPRINT MIND Trial[J]. J Am Heart Assoc, 2021, 10:e022206. doi:10.1161/JAHA.121.022206. |
| [21] | STEVENS S L, WOOD S, KOSHIARIS C, et al. Blood pressure variability and cardiovascular disease:Systematic review and meta-analysis[J]. BMJ, 2016, 354:i4098. doi:10.1136/bmj.i4098. |
| [22] | FAN Y, HOU C, PENG L, et al. Twenty-four-hour ambulatory blood pressure variability associated with cerebral small vessel disease MRI burden and its progression in inpatients with cerebrovascular disease[J]. Front Neurol, 2020, 11:513067. doi:10.3389/fneur.2020.513067. |
| [23] | GAO H, WANG K, AHMADIZAR F, et al. Changes in late-life systolic blood pressure and all-cause mortality among oldest-old people in China:The Chinese longitudinal healthy longevity survey[J]. BMC Geriatr, 2021, 21(1):562. doi:10.1186/s12877-021-02492-4. |
| [24] | DEKKER M, USVYAT L A, KONINGS C, et al. Changes in pre-dialysis blood pressure variability in the first year of dialysis associate with mortality in European hemodialysis patients:A retrospective cohort study on behalf of the MONDO initiative[J]. J Hum Hypertens, 2021, 35(5):437-445. doi:10.1038/s41371-020-0354-0. |
| [25] | BILO G, DOLAN E, O'BRIEN E, et al. The impact of systolic and diastolic blood pressure variability on mortality is age dependent:Data from the Dublin Outcome Study[J]. Eur J Prev Cardiol, 2020, 27(4):355-364. doi:10.1177/2047487319872572. |
| [26] | BAHADORAN Z, MIRMIRAN P, KASHFI K, et al. Hyperuricemia-induced endothelial insulin resistance:The nitric oxide connection[J]. Pflugers Arch, 2022, 474(1):83-98. doi:10.1007/s00424-021-02606-2. |
| [27] | GALLO G, VOLPE M, SAVOIA C. Endothelial dysfunction in hypertension:Current concepts and clinical implications[J]. Front Med(Lausanne), 2021, 8:798958. doi:10.3389/fmed.2021.798958. |
| [28] | DIAZ K M, VEERABHADRAPPA P, KASHEM M A, et al. Relationship of visit-to-visit and ambulatory blood pressure variability to vascular function in African Americans[J]. Hypertens Res, 2012, 35(1):55-61. doi:10.1038/hr.2011.135. |
| [29] | YOUNG B E, GREANEY J L, KELLER D M, et al. Sympathetic transduction in humans:Recent advances and methodological considerations[J]. Am J Physiol Heart Circ Physiol, 2021, 320(3):H942-H953. doi:10.1152/ajpheart.00926.2020. |
| [30] | BARTOLÁK-SUKI E, SUKI B. Tuning mitochondrial structure and function to criticality by fluctuation-driven mechanotransduction[J]. Sci Rep, 2020, 10(1):407. doi:10.1038/s41598-019-57301-1. |
| [31] | PANG S, JIANG Q, SUN P, et al. Hyperuricemia prevalence and its association with metabolic disorders: A multicenter retrospective real-world study in China[J]. Ann Transl Med, 2021, 9(20):1550. doi:10.21037/atm-21-5052. |
| [32] | MAGNACCA S, COSTANZO S, DE CURTIS A, et al. Determinants of serum uric acid levels in an adult general population:Results from the Moli-sani Study[J]. Clin Rheumatol, 2021, 40(3):857-865. doi:10.1007/s10067-020-05288-w. |
| [1] | JIA Wei, TIAN Zhi. Correlation between Furin promoter methylation levels and blood pressure of non-diabetic population in a community [J]. Tianjin Medical Journal, 2025, 53(9): 987-992. |
| [2] | DU Xintao, SUO Ying, ZHAO Xiaoyun. Research progress on the bidirectional relationship between sleep-related breathing disorders and pulmonary hypertension [J]. Tianjin Medical Journal, 2025, 53(8): 889-896. |
| [3] | WU Bin, YANG Zigeng, JIN Ling, ZHANG Jing, WEI Hongmei, CAI Bingbing, WEI Yuying. Effect of miRNA-381-3p/MuRF1 axis on cardiopulmonary injury in mice with hypoxic pulmonary hypertension [J]. Tianjin Medical Journal, 2025, 53(6): 571-577. |
| [4] | WU Bin, YANG Zigeng, ZHANG Jing, LI Shuhong, YU Feng, WANG Jiawei, LI Cailing. Effect of naringenin on right ventricular remodeling induced by hypoxic pulmonary hypertension [J]. Tianjin Medical Journal, 2025, 53(2): 129-134. |
| [5] | WANG Lyu, LU Hong. The evaluate value of combined plasma ET-1 and NO levels in maternal and infant outcomes of patients with hypertensive disorders in pregnancy [J]. Tianjin Medical Journal, 2025, 53(11): 1185-1190. |
| [6] | WU Caixin, YAN Yan, DENG Yuanlin, DU Yamin, YANG Zhenwen, PAN Qing, YANG Fan. The value of cardiac magnetic resonance in evaluating severe pulmonary hypertension associated with connective tissue disease [J]. Tianjin Medical Journal, 2024, 52(7): 691-694. |
| [7] | WANG Hui, PAN Qing, WANG Zhouming, ZHANG Na, YANG Zhenwen, WEI Wei. Analysis of clinical features of mixed connective tissue disease associated with pulmonary arterial hypertension [J]. Tianjin Medical Journal, 2024, 52(7): 701-703. |
| [8] | LI Yong, SU Yakun, ZHANG Hongbo, LI Yuan, LI Zhanhu, YAN Xiaoju. Clinical significance of serum asprosin level in patients with early renal damage of essential hypertension [J]. Tianjin Medical Journal, 2024, 52(6): 609-613. |
| [9] | ZHENG Kangpeng, TANG Xinguo, XU Qi, FAN Yuting, LIANG Bo, FU Xiaowei, FANG Lu. Nomogram construction and validation for predicting the possibility successful implementation of radical surgery in gallbladder cancer patients [J]. Tianjin Medical Journal, 2024, 52(5): 536-540. |
| [10] | ZHANG Liran, ZHAO Yanhua. The predictive value of MP hypertension monitoring system combined with PLGF and PI for preeclampsia [J]. Tianjin Medical Journal, 2024, 52(3): 306-310. |
| [11] | CAO Junyang, MA Chunxing, LIU Zhina. Predictive value of vitamin and folic acid levels in gestational diabetes mellitus complicated by preeclampsia [J]. Tianjin Medical Journal, 2024, 52(12): 1278-1282. |
| [12] | QIN Chundi, MA Wen, LI Yuan, ZHU Yaquan, LI Yu, ZOU Lin, ZHANG Xin. Butyrate reduces blood pressure in hypertensive rats by activating the G protein-coupled receptor 41/43 pathway [J]. Tianjin Medical Journal, 2023, 51(9): 972-976. |
| [13] | ZHANG Zhaoxia, NAN Xingmei, LI Zhanqiang, LU Dianxiang. Research progress on the role of potassium channels and drug intervention in hypoxic pulmonary hypertension [J]. Tianjin Medical Journal, 2023, 51(8): 892-896. |
| [14] | ZHANG Wenjing, WEN Dehui, ZHENG Yingjuan, LI Chaoxi, NIU Yajun, MIAO Qing. The study of QAS combined with QIMT technology on carotid atherosclerosis in patients with normal high blood pressure [J]. Tianjin Medical Journal, 2023, 51(6): 662-667. |
| [15] | JIANG Xiaocui, TIAN Daizhi, ZHAO Min, GONG Jian, YU He, JIANG Xingyu, XIAO Min. Effects and mechanism of hyperuricemia on spermatogenesis and sperm quality in mice [J]. Tianjin Medical Journal, 2023, 51(4): 376-381. |
| Viewed | ||||||
|
Full text |
|
|||||
|
Abstract |
|
|||||